MR question


Hi Community,
I have a bit of a problem with my MR the filter was resolve by comments from BrunoRodriguez but there is still some issues present.
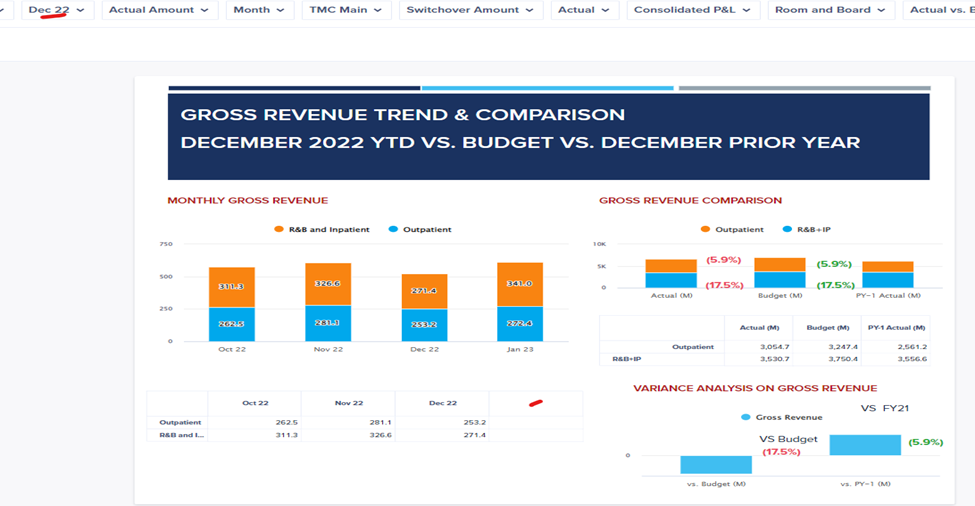
Requirement: When user select Dec 22 on the page selector, the graph should show Dec 22 Nov 22 Oct 22 and Sep 22. It is always current time and previous 3 mos.
Example: this one is not correct, I selected Dec 22 but it only displays Jan 23 Dec 22 Nov 22 and Oct 22. And the table below only displays 3 mos.
When I select Jan 23 the table below only shows Jan 23 and the graph does not change.

I am using a filter that was previously answered by BrunoRodriguez.
Anyone with any insights will be greatly appreciated.
Regards,
Answers
-
Hi @Jsdeloria21 ,
If the requirement is to always display current month + past 3 months of data, then it would be a straight forward time filter in a SYS module that you can define and apply to chart and grid cards (you won't need context selector in this case).
But your requirement seems to allow user to change the time selection. Please note that you can't publish an editable card (field card) for user to change on MR, like we do on other UX pages. The only way you can achieve this is to allow user to make time selection on a normal UX page, and use that selection to filter the months you display on MR. You might display the selection and a link to the page where it is selected, like shown in this sample:


If you use context selector, and hence turn on hierarchy filter for Time, the cards will show months falling in same quarter based on selected month , but not as current month + past 3 months.
Lastly, please ensure you maintain same filters/time settings for both chart card and grid card, to display same months as per the ask.
Cheers!
0 -
hi @AjayM,
Appreciate you taking time in providing feedback on my concern. I already have a filter in place. but the table below is inconsistent when changing time.
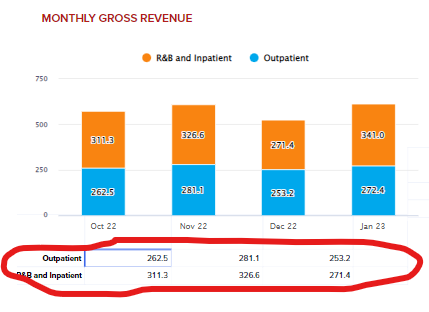
like in this scenario, I selected Dec 22. the graph should display Dec 22 Nov 22 Oct 22 and Sep 22. instead it is only showing Jan 23 Dec 22 Nov 22 and Oct 22. Also the table below does not follow the current month + 3 mos prior on the filter. below is the filter I am using with the help from @BrunoRodriguez .


this is where the problem lies. the table below the graph does not follow the filter when time is changed.
Hope to hear from you soon.
Thanks in advance.
Regards,
0 -
Thanks for explaining.
I am able to replicate the 'issue' here, and it's not just the table/grid, but also the graph, that doesn't get updated, when we change the current month (either through model time settings or through time formatted lineitem) and try refreshing the MR using MR's default refresh icon.
Instead of refresh icon, if you close the MR or just go back to any other page and revisit MR, you should find both the graph and table getting updated (as long as you have same filter applied for both of these cards without any time sync).
While this is not the best work around and I'd recommend raising a support ticket for this, the alternate method that I suggested above, is to use a user dimensioned time-formatted lineitem (field card) on a different page, and use that to filter your time, which works just fine - since this indirectrly involves user having to visit a different page for changing time selector and coming back to MR, which thus refreshes both chart and the grid. Steps in detail:
- Create a user dimensioned module with timeperiod formatted lineitem for user to select month
- Define time filter as shown in snapshot below
- Publish lineitem defined in (1) on an admin page or on the page that falls prior to MR, from where user can select/change the month
- Filter table and chart on MR using the filter in (2)
- You might want to add a navigation link to page mentioned in (3), on MR, for ease of access for user


Cheers!
0 -
Hi @AjayM,
what is the purpose of the select time line item, will this be a selector on the MR page or in the page selector? Just to clarify the above process.
Thanks again for the feedback.
Regards,
0 -
Since we can't add editable selector on a MR, and even a context selector will not serve your purpose (to filter current month and past 3 months for every 'selected month'), my alternate is to publish 'Select Time' on a different UX page for user to choose a month (Dec 22 or Jan 23 in your example), and based on this selection, we filter chart and grid to show selected month + relative past 3 months.
Please note in my snapshot above that 'Select time' is used to filter required months in SYS module.
0 -
Hi @AjayM,
I get it now. Like a page where they can set up the date for the MR.
Appreciate the clarification as well as the help.
Regards.
1
