Sankey (Flow + Magnitude) Charts


Hi Anaplan,
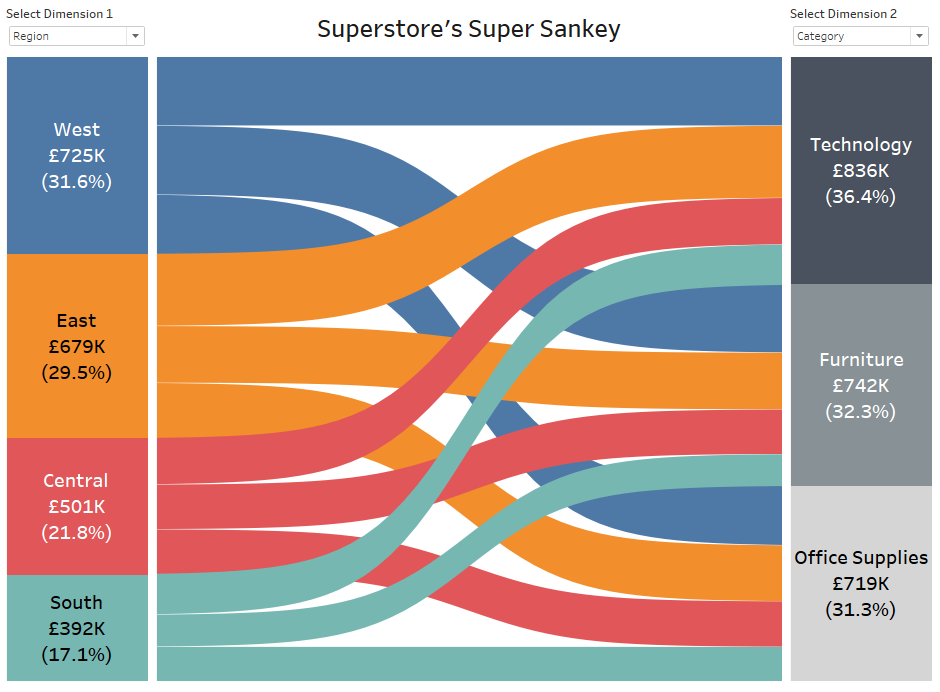
We've had a few requests now for Sankey charts to show flow direction of data as well as the magnitude of this flow.
Especially pertinent in allocation processes where you it would be great to be able to visualise the movement of data from one location to another i.e. Allocation of L3.C to G5.A & G5.B; or Sales in Region "West/East/Central/South" are made up of Sales of Product Group "Technology/Furniture/Office Supplies".
All the best,
Greg
Tagged:
15
Comments
-
Status changed to: New0
-
McKinsey has requested this chart 12/2020.
0


Get Started with Idea Exchange
See our Submission Guidelines and Idea Evaluation Criteria, then start posting your own ideas and showing support for others!