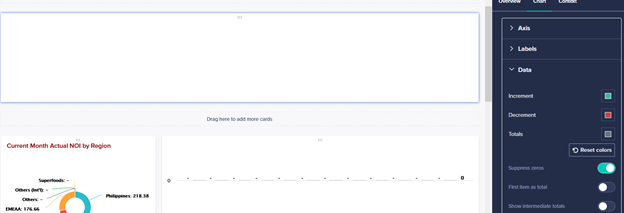
Line item is not appearing in Watefall Chart
Hi Community,
We have a table in our model where we created a waterfall chart to show the values. But for some reason it is not displaying in the waterfall chart despite having values on the line item.see below.


below is the value for the line item. we use the show/hide option to display only the line item the client need. only the Current Month Actual NOI line item is not diplsyaing even if we use a different chart like donut chart

it is showing 0 values.

hope you can provide some insights on the matter. Appreciate any help here
Thanks and Regards,
Best Answer
-
The steps of the waterfall chart suppose to be pivoted as rows.
Check this help page https://help.anaplan.com/0febc1d7-584f-47f8-9f88-f869b5ccd159-Generate-a-Waterfall-Chart
0
Answers
-
hi Kirilkuznetsov,
first of all appreciate you taking time in providing answers to my query.
the line item in question is already in the row section but when I change the chart into another type of chart that line item is showing. see below.


but when i revert back to waterfall chart. this is what I get

just 1 line item appears.
Regards,
0 -
Could you share which selections are mare in the page selectiors?
Maybe if it's selected Total periods and you have 0 in total it hides zero values.0


