Outliers in time series data are values that differ greatly from the rest of the time series. Outliers can be caused by measurement errors, data entry errors, organic real occurrences such as seasonal effects and other reasons. Since outlier values could impact the accuracy of the predictions produced by forecast models based on the time series data, it is important to find them and determine how should they be handled.
There are three main types of outliers:
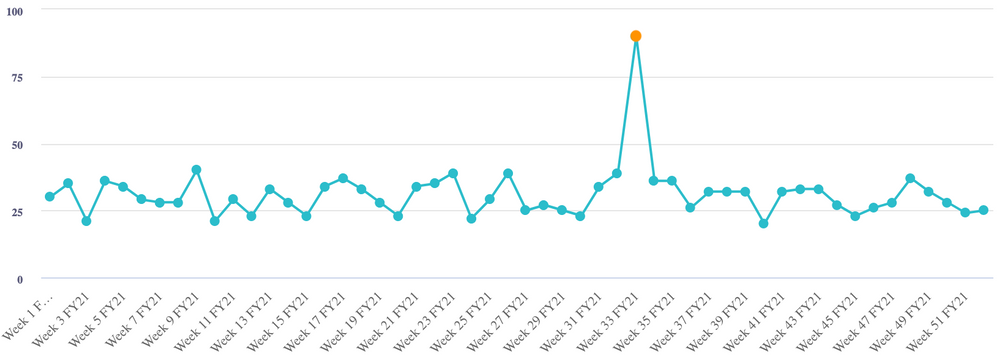
- Point (global) outliers: a value is far from the rest of the values in the time series.
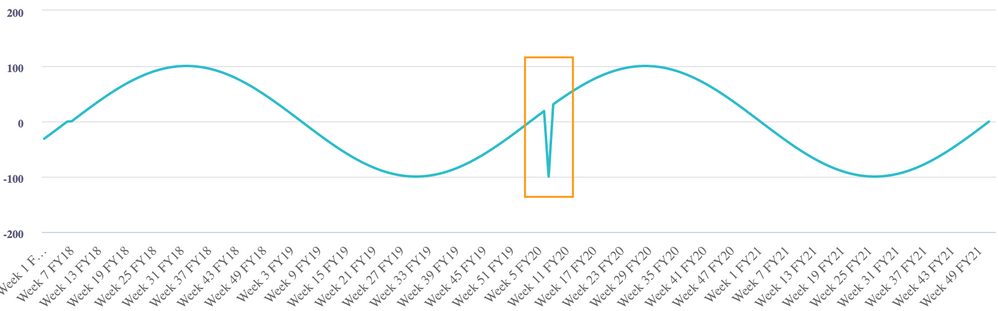
- Contextual outliers: the point in time at which the value appears makes it an outlier when measured against other points in time.
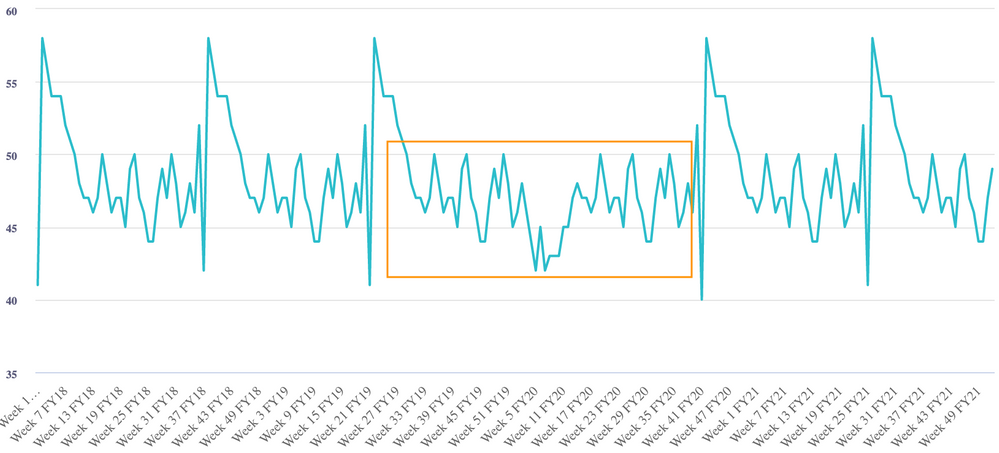
- Collective outliers: a collection of values that as a group deviate from the rest of the values in the time series.
Point outliers and contextual outliers are more common forms of outliers, and therefore will be the focus of this article.
Outliers can be detected in many ways. For instance, one could visualize the time series data and see if any outliers stand out visually. Another common method is to calculate the number of standard deviations from the mean value of the time series, and flag values that are several standard deviations away from it. Outliers can also be detected by creating a forecast model using the time series data, predicting the values in each time period and identifying the times where the prediction errors are substantial.
Once an outlier has been detected, it’s important to investigate what has caused the outlier to occur, if there is an option to do so. After establishing the reason for the presence of the outlier, consider whether any adjustments need to be made to the data.
If the outlier originates in an error, it’s recommended to take out the value from the time series by removing the observation from the data, or by replacing the value with a more suitable value. This could be done in several ways. For instance:
- Leverage the Exclude Value functionality, which will replace the outlier a value based on an automated logic
- Create a forecast model and predict the value for the period in which the outlier is present, then replace the outlier with the forecasted value
- Replace the outlier manually
If the outlier represents a real observation (e.g. fluke, rare anomaly), consider whether the time series forecast model should account for such occurrences. For instance, it is generally recommended to remove outliers that are caused by one-time isolated events, as the forecast model would most likely not be able to predict those going forward. The outliers can also be replaced according to the methods mentioned above. In addition, related time series data (drivers) such as special event or holidays can also be used to better guide the algorithms in forecasting when outliers may occur.
Note that keeping outlier values in the time series would typically result in the forecasting of values greater or smaller compared to other predicted values. When tested against backtest windows, one can compare the accuracy of the forecasts with and without the presence of outliers, and determine which approach results in greater accuracy.
Questions? Let us know in the comments.
Contributing authors: Nitzan Paz, Christophe Keomanivong, Frankie Wolf, Andrew Martin.
