Hi Community,
I would like to ask for any suggestion or recommendation on the requirement below. Any feedback will be greatly appreciated.
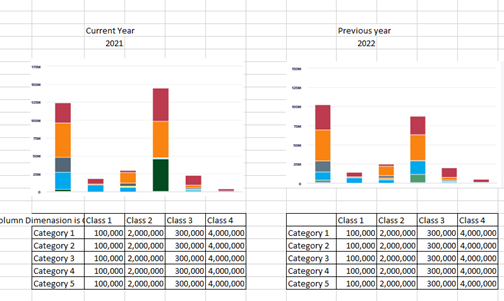
Requirement: in the MR pdf slide client would want to see 2 graph (Current Year and Previous Year, see below for screenshot).
My apologies in advance if I was not able to provide the actual table. Not sure if I can since we have confidentiality agreement with the client. But just to sure and for the sake of presentation. I recreated them for you guys to understand. Column Dimension is Class dimension and TIME (not relevant). So if the user select FY21 on the time page selector automatically the table of the left is the current year (this Is working already) I already sync the page selector to the table and graph. However is it possible to automatically have the 2nd table Previous Year always? Is there a setting that I can select to make sure this table on the right is always previous year? At the moment since we only have data in 2021 I fix the time on the right table and graph to 2020. But when the time comes that they already have a data for 2022. The table on the right should present as 2021 already. Is there any recommendation or suggestion on how to achieve this requirement?

Thanks and Regards in advance,