PlanIQ provides us with an easy-to-use and intelligent time series forecasting tool. It integrates with the Anaplan platform and incorporates advanced machine learning and statistical forecasting algorithms.
In this article, I explore functionalities that PlanIQ offers using a sample data set and the preparation steps outlined in the Anaplan Academy's Course: Setting up Anaplan data for PlanIQ. The sample data contains three years of weekly sales volume by product item along with the item price and related data that indicates whether there is a promotion during the week. I also created a report module and some UX pages for easy visualization of the functionalities.
Preparing the Anaplan models:
Before we can configure PlanIQ to make predictions, we need to have several things ready in the Anaplan model.
Anaplan modules
In general, there are two groups of modules that need to be built in Anaplan.
- Modules that will store the source data, which can be further categorized into:
- Historical data - main set of data used to generate the forecast (ex. sales volumes)
- Related data - additional drivers that can impact the forecasted values such as product price or promotion schedule. Related data is optional.
- Attributes - characteristics of the data that can help identify patterns like product size. Attributes data is also optional.
- Module that will store the forecast results
Below is the model map of those modules and a custom report module that combines the forecast results with the actuals for easier presentation on the UX pages.


Anaplan actions
There are two groups of actions that need to be built in Anaplan.
- Export actions - to load the source data from Anaplan the model to PlanIQ (one action for each source data module)
- Import action - to load the forecast results from PlanIQ back into the Anaplan model
_136304.JPG?large?v=v2&px=999)
_136304.JPG?large?v=v2&px=999)
Configuring PlanIQ:
Once we have the Anaplan model ready, we need to set up our objects in PlanIQ:
- Data collection - data set that will be forecasted
- Forecast model - algorithm that will be used to train forecast model
- Forecast action - to generate predictions based on the forecast model and import the results back to Anaplan model
Data collections
Here, I created a data collection named Historical Sales Data Collection_2

with the following properties:

Here is a quick look at the data for a particular product item:
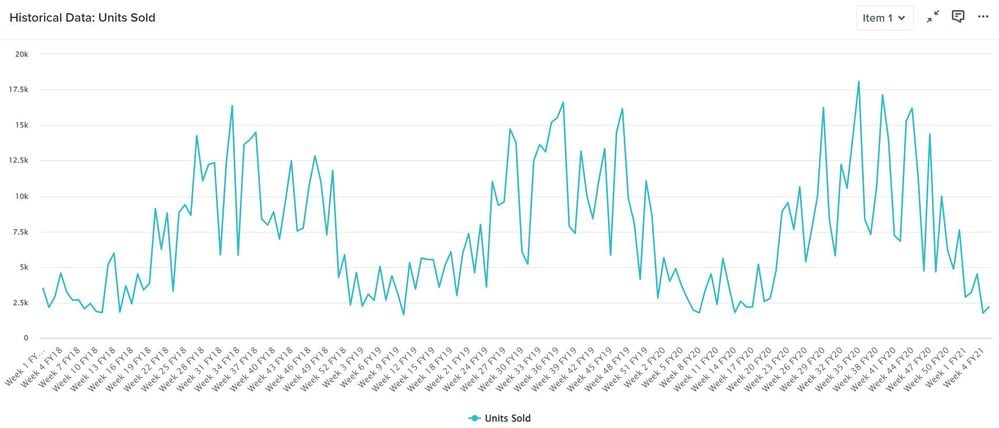
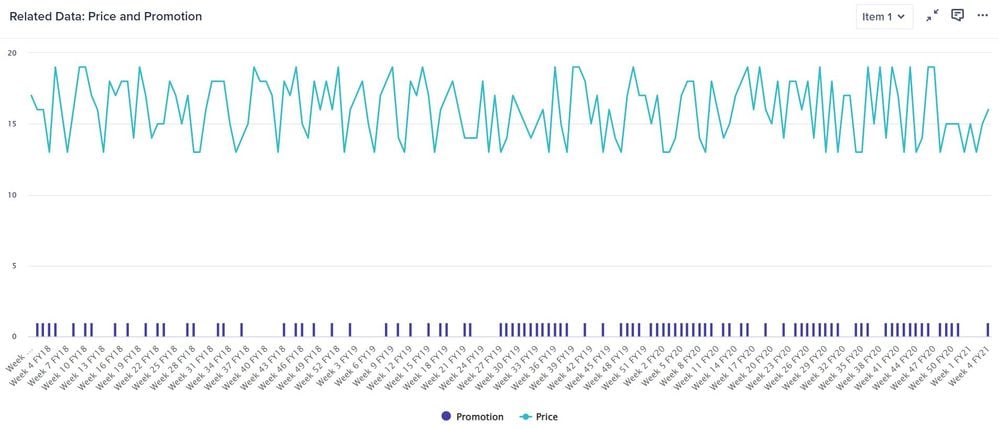

Forecast models
I chose to create a forecast model using Anaplan Auto ML which is supposed to find the best algorithms that fits our data set among all machine learning algorithms within PlanIQ. A list of the machine learning and other algorithms can be found here.

PlanIQ will train the model that we have specified using the data set provided. During model training, the data set will be divided into two sets: a training and a validation set. The training set is used to build the model parameters while the validation set is used to find the optimal hyper-parameters based on forecast accuracy metrics.
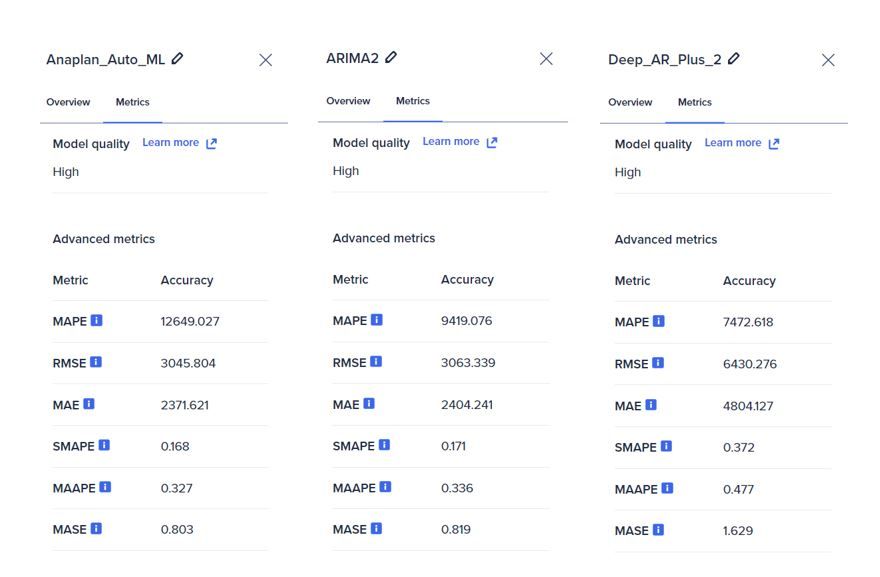
Below is an example of the forecast accuracy metrics from the training in addition to the overall model quality. To know more about each metric, please click here.

However, reading the accuracy metrics alone hardly give us an insight into the performance of the forecast model. In this case, PlanIQ provides us with the ability to import backtest data so that we can compare the forecast result with the actuals of the data set that is used to train the model. Importing backtest data can be done via the Overview tab of our forecast model. In my opinion, it would be helpful if PlanIQ indicates which algorithm AutoML selected to the user has more information.
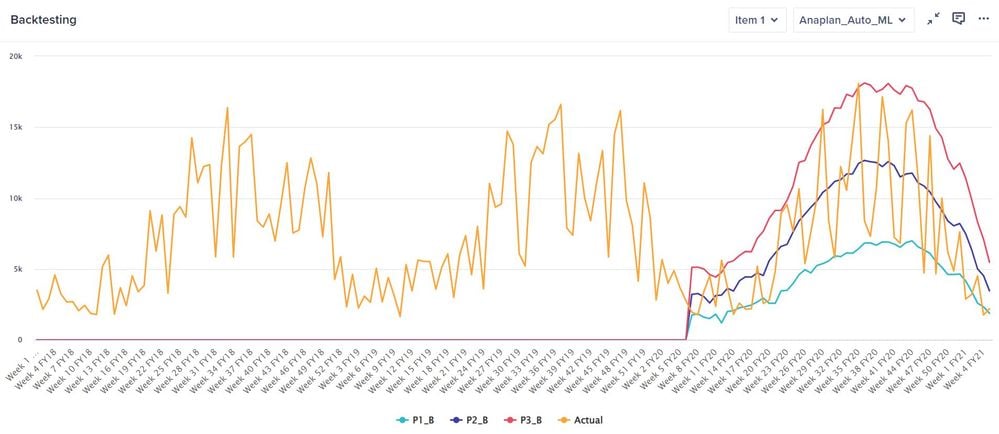
Reviewing the backtest data allows us to consider whether we should try different forecast algorithms. Below are backtest data from two other algorithms that I also setup: ARIMA which is part of statistical algorithms and Deep AR Plus which is one of the machine learning algorithms available in PlanIQ.
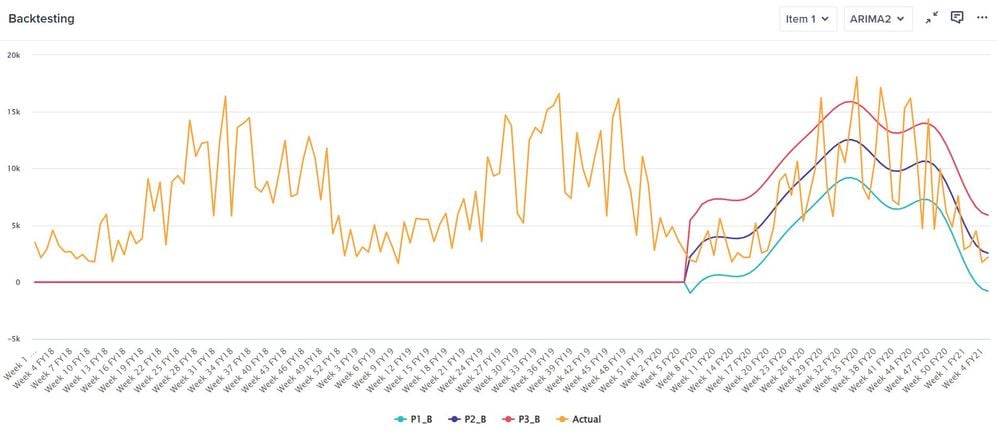
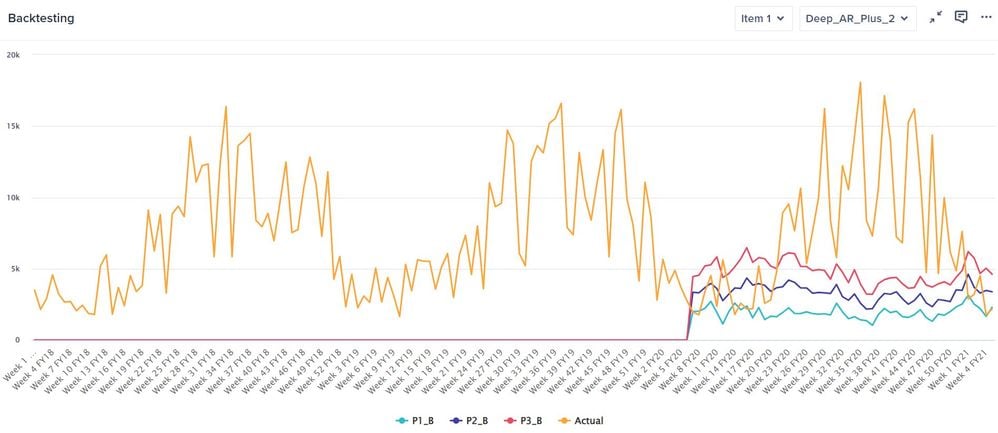
It appears that ARIMA generates a smoother forecast, which is due to the moving average component of the algorithm. Both Anaplan Auto ML and ARIMA look like they perform well. They are able to track the actuals curve. This can be confirmed by their metrics. AMIRA and Anaplan Auto ML's are very different except the MAPE. However, unlike Anaplan Auto ML, ARIMA cannot take advantage of related data and attributes. On the other hand, as Anaplan Auto ML needs to run through different algorithms, training time takes longer. Deep AR Plus does not seem to fit the data well and the metrics are also much higher (lower is better) than the other algorithms.
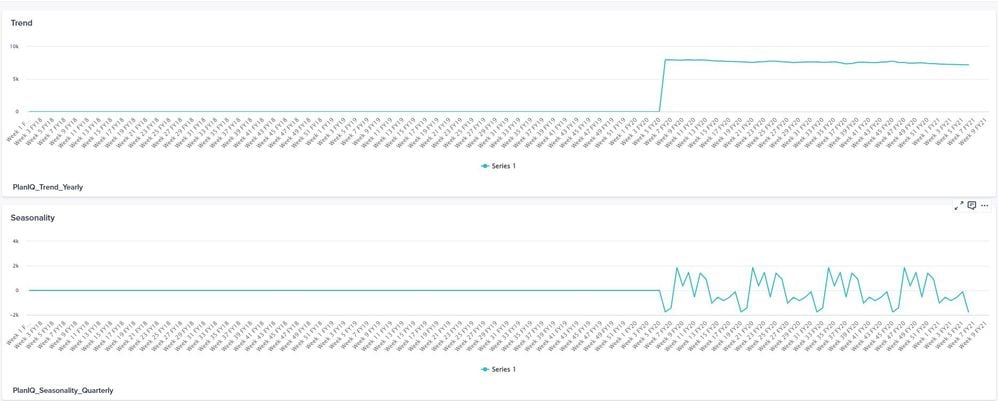
In addition to producing the forecast, PlanIQ also helps us understand the trend and seasonality of our data, which is useful when working with time-series data. In the picture below, though the data set shows a flat yearly trend for the past 53 weeks, we can see that there is a clear quarterly seasonal pattern in the data.
Forecast actions
Forecast actions generate the predictions for future periods based on the model parameters built during the training. They also import the results back into the Anaplan model.


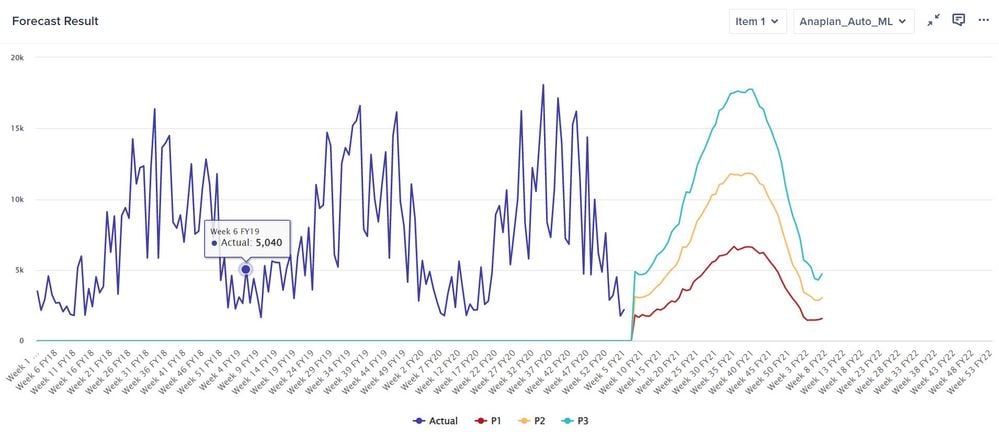
PlanIQ generates a probabilistic forecast range by allowing us to specify the lower and upper quantiles, in this example 0.1 (10%) and 0.9 (90%) respectively. Under this confidence interval, we can expect the forecast lower and upper bounds to include the true observed values 80% of the time.
Below is an example the forecast range produced. P1 indicates the lower bound of the forecast at 10% quantile, P2 the median, and P3 the upper bound at 90% quantile.
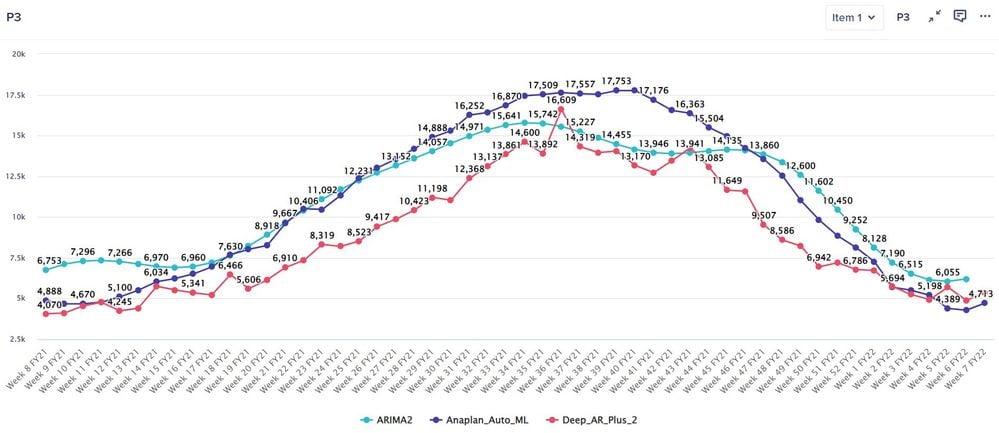
As PlanIQ provides a number of forecast algorithms, we can compare how different algorithms produce the forecasts. Below is a P3 forecast comparison of three algorithms on the same data set.
We have seen that PlanIQ provides a wider range of forecasting capabilities to the business users, expanding options beyond simple approaches like using the last available actuals or an average over the past few periods. Please refer to Anapedia for more detailed information.