Hi,
I am trying to create a gantt chart to track the progress on the staffing of position within a workforce planning model.
I have create a module with a start and an end date. The module only has Position dimension.
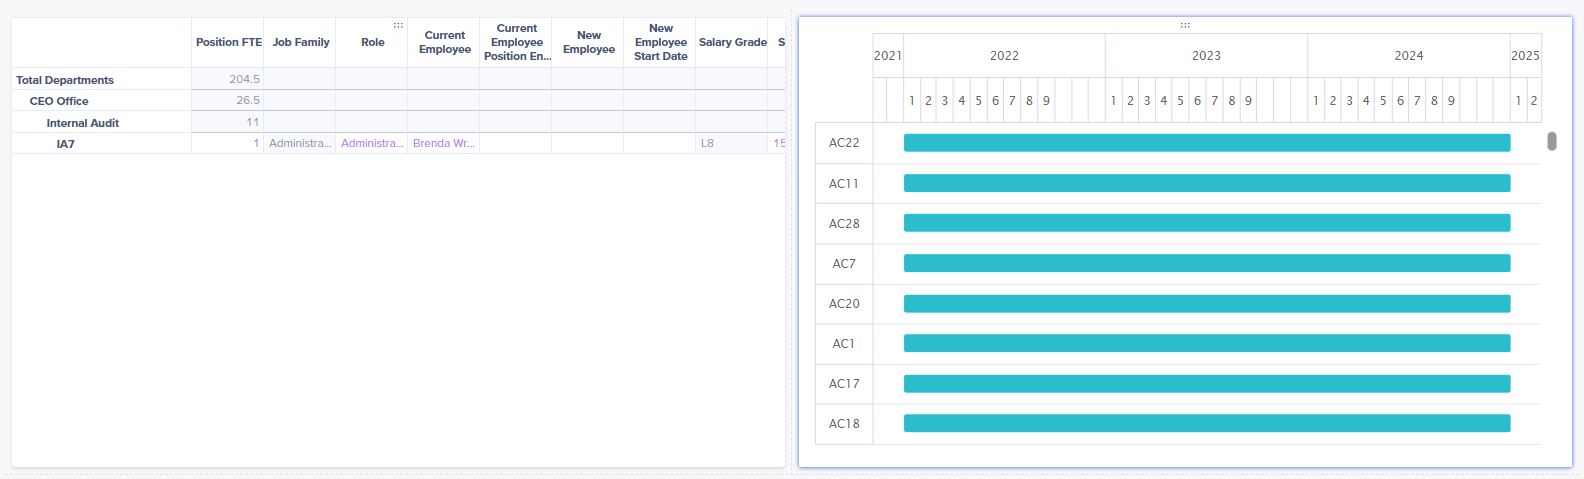
Issue #1 (picture 1):
The graph does not display well. We can see yeas and number 1 to 9 (which I have no idea why it stops at 9.
Issue #2 (picture 2 - dashboard view & 3 - module view): When I try to apply a filter to the position list (I've tried both with and without user dimension filter), tha gantt chart shows an error and does not display anymore.
Any idea where those 2 issues come from ?