If you are asked to name a few features which you use very often in Anaplan, there is a high chance that FILTERS will find its way to that list. There are so many places where they are used: saved views for imports/exports, report creation, calculations, and the list goes on. They are basically ubiquitous!
Premise: Ability to filter items of a list based on attributes
Let’s say there is a footwear company which sells the following products:

Now, assuming they are doing a forecasting exercise, and it is required to analyze/adjust forecast volume for a narrowed-down group of products, it can be easily done by building filters to display only those products which they would like to see based on selection of attributes as shown below. Here, the products are filtered based on: Gender = Men, and Color = Black

What if the requirement is to select not just Black, but also Brown at the same time - meaning being able to select multiple items within the same list. This is certainly not possible with the above approach as it limits our selection to just one list item at a time.
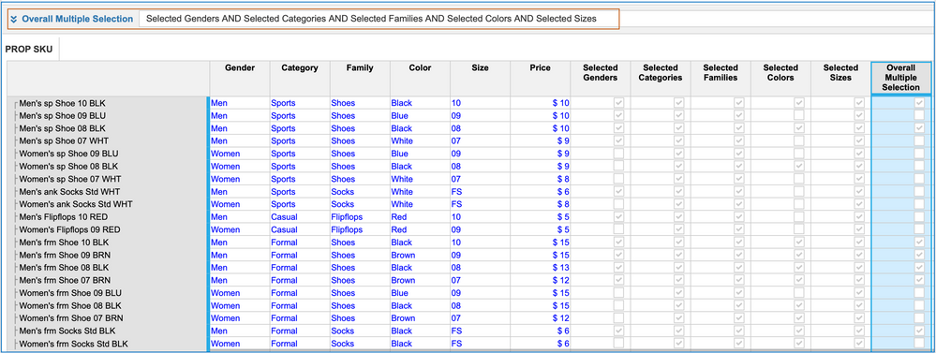
This is where Multi-select filtering can help us, as shown in below page:
(Observe that the grid shows only those items which have been selected in the attribute filters)

Now, let’s look at what is happening behind the scenes (front to back):
1. A single Boolean filter (Overall Multiple Selection), driven by attribute specific filters (Selected Genders, Selected Categories, Selected Families, Selected Colors, and Selected Sizes)
1a. Blueprint view below (observe formula for any one of the attribute specific filters)

2. Upstream module of an attribute specific filter (example: Color)

NOTE: This is the module which is published in the UX page for filtering by end-users
2a. Blueprint view below (observe Summary method of the Select line item)

NOTE: Similar modules are to be created for other attributes as well (Gender, Category, Family, Size), and then linked to the main filter module.
Extension: Continuing with the same example of forecast analysis, let us say the next requirement is to aggregate and report the Total forecast value of only the selected products. This can be done by following the below steps:
1. Include Forecast value of only the selected items using an IF ELSE condition as shown below:
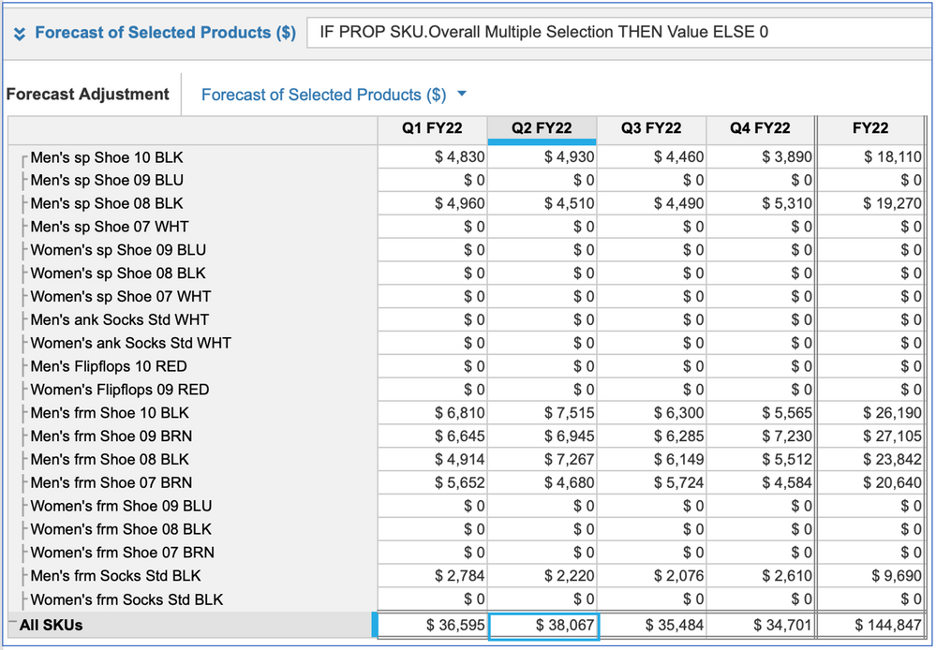
NOTE: Individual Forecast values are found using Forecast Volume x Price, where Price is part of Master data
2. Create a summary module to show the Total Forecast value by quarter:

(observe that this Total Forecast value is published as a KPI card in a previous screenshot of UX)
In this way, one can make use of the filters effectively to achieve desired results!