Calculating levels in a hierarchy for dashboard filtering
Summary
This article describes the technique to dynamically filter specific levels of a hierarchy on a dashboard, and provides a method to select and visualize hierarchies on a dashboard.
Details
This article explains how to configure the calculation of the level of a list in a hierarchy in order to apply specific calculations (custom summary) or filters by level on a dashboard.
In this example, we have an organized hierarchy of 4 levels (Org L1 to Org L4). For each item in the hierarchy, we want to calculate a module value that returns the associated level that is to be displayed on a dashboard.
Notes and platform context
- The technique addresses a specific limitation within dashboards where a composite hierarchy's list level cannot be selected if the list is synchronized to module objects on the dashboard.
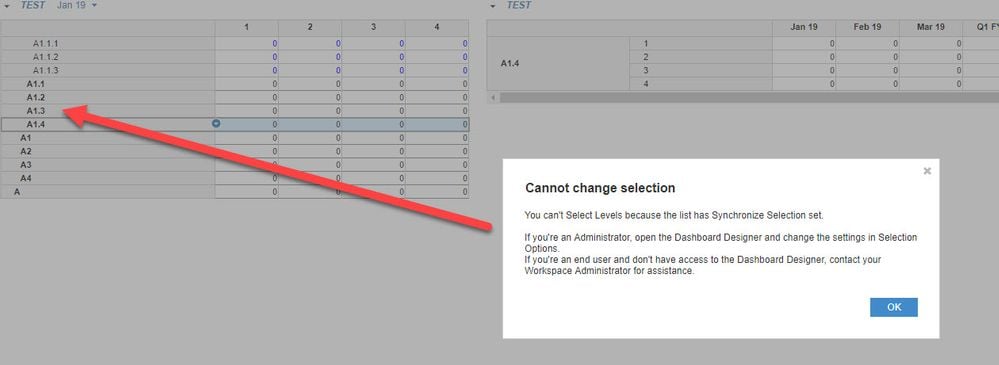
- The technique uses a static module based on the levels of the composite structure used for filtering of the object on a dashboard.
- The technique is based on utilizing the Summary Method "Ratio" on line items corresponding to the list levels of the composite hierarchy to define the values of the filtering line items. Note that this method is not a formula calculation, but rather a use of the Summary Method Ratio on each line item applied to the composite hierarchy.
Example list
In this example, a four-level list composite hierarchy list is used. The hierarchy in this example has asymmetrical leaf items per parent:
Defining the level of each list
In order to calculate the level of each item in each of the lists L1 - L4, we need to create a module that calculates the associated level of each member by this technique:
1) Create as many line items as levels of hierarchy, plus one technical line item
2) Configure the settings in the blueprint of the line items of this filtering module, per this example and table:
Line Item |
Formula |
Applies to |
Summary |
Summary method Setting Ratio |
Technical line item* |
1 |
(empty) |
Formula |
|
Level or L4 (lowest level) |
4 |
Org L4 |
Ratio* |
L3 / Technical |
L3 |
3 |
Org L3 |
Ratio |
L2 / Technical |
L2 |
2 |
Org L2 |
Ratio |
L1 / Technical |
L1 |
1 |
Org L1 |
Ratio |
L1 / Technical |
|
|
|
|
|
When applying these settings, the filtering module looks like this:
*Note the Technical line item Summary method is using Formula. Alternatively, The Minimum Summary Method can be used but will return an error when a level of the hierarchy does not have any children and the level calculated is blank.
The filtering module with Summary method applied results:
Use the line item at the lowest level—Level (or L4) (LOWEST)—as the basis of filters or calculations.
Applying a filter on specific levels in case of synchronization
When synchronization is enabled, the option “Select levels to show” is not available. Instead, a filter based on the level calculated can be used to show only specific levels.
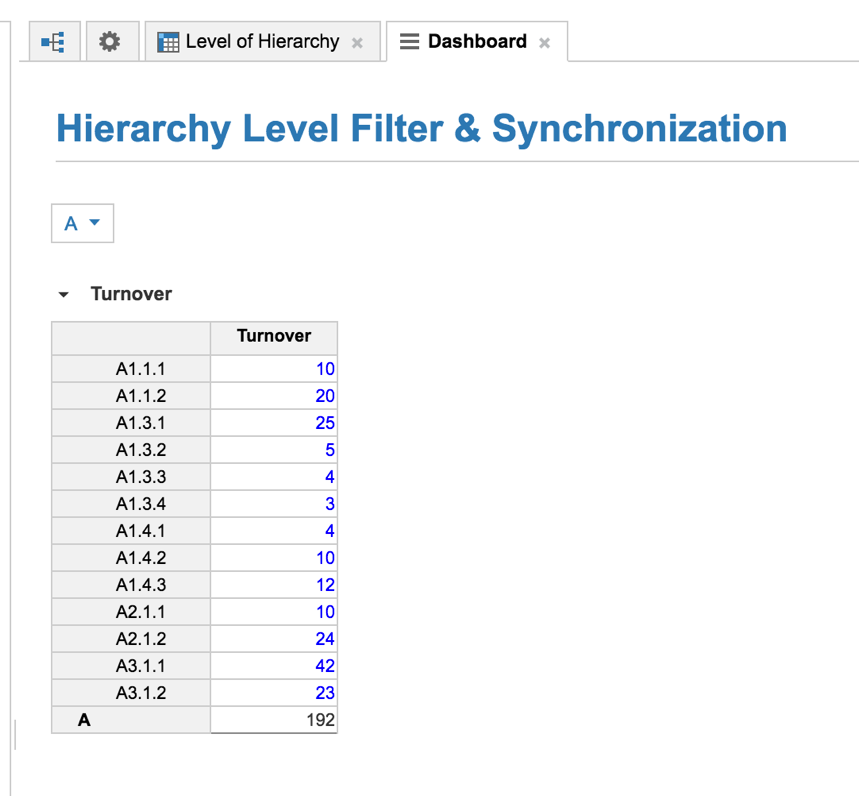
In the example, we apply a filter which matches any of the level 4 and 1:
The following filtered dashboard result is achieved by using the composite hierarchy as a page selector:
Comments
-
Hi Mark,
Can you provide another screeh shot showing what your are filtering in the dashboard please?
I was expecting a drop down of level number to filter on levels. I have built the saved view - filtered the 'Turnover' module based on level numbers of the 'Hierarchy Levels' module but this is now hardcoded to Level 4 or Level 1. If hardcoded then how am i filtering it in the dashboard? Is your page selector simply enabling selections on the resulting filter? Thanks
4 -
Hi,
I see some posts around this topic and it is a request that keeps coming up from clients now and then.I've managed to create a user-specific Boolean selector to filter levels in a hierarchy using just one boolean filter in the report.
A simple combination of formulas and summaries, check it out and let me know if you would like to know more.
Boolean and user specific multilevel selector
5 -
This is a brilliant post. I used it to build a reporting module that dynamically calculates the hierarchy level chosen from selectors and uses them to populate the "group by" attribute for the RANK function. Works like a charm.
I could not have possibly solved it without this article.
Honestly, I can think of a dozen use cases that could use this logic. Thank you, thank you!
Only small change I would recommend is on the ratio for L1, I set that to NONE and it worked. setting the same as L2 caused a circular reference error.
3 -
This is one of the most clever solutions I've seen. I continue to wonder what train of thoughts could lead someone to such a solution. Huge Kudos
I believe there is a typo though. The summary method for the highest level (L1) can't be L1/Technical. You can't really use the same line items is the ratio settings of itself.
The correct way - or the way I implemented it - is for the summary ratio to be Technical/Technical, which will resolve to 1/1 = 1 which in turn is the number we need.
for those who implemented the solution (@JaredDolich), did you come across the same issue?2 -
Good callout @einas.ibrahim I did have to use a little ingenuity but the overall strategy is sound.
I use this often as I'd rather use filters than "select level". Filters seem more reliable to me when using imports/exports.
0 -
You could actually go a step further and, using the level number as above, create either a general 'Levels' list or more specific level list eg Cost Centre L7, Function L6, BU L5 etc. to make it more understandable to the user and possibly easier to filter (as you can select multiple levels in the same filter drop down when filtering on a list).
2 -
Good article and thanks. Any suggestion on managing a customized sequence of a list members (both on the list and on a dashboard)?
1) When creating a list (via integration), what's the best way to order the members?
2) Any way for the dashboard users to sort a list with customized order without using 'select item to show' (a.k.a. sync'd selection)?
0 -
Great solution! Exactly what I was looking for to facilitate creating different formulas at different levels of a hierarchy.
Thank you for posting this.
0 -
This is a great solution!
The only thing I added was a Boolean that referenced "L4" with a summary method of Formula. I did this because in theory, filtering off the Boolean should perform better than filtering off multiple numerical values. In my case, I wanted to filter out the 2nd out of 4 hierarchies, so my Boolean was = 'L4' <> 2.
0 -
Hi! This was a great solution! now we are able to show the levels we want. Thanks!
0 -
Here is an alternate method:
My composite hierarchy has three levels: E1, E2, and E3.
In a SYS (properties) module for E3, add the line items in the table below.
The line item Level = 0 for the top level item, 1 for E1 items, 2 for E2, and 3 for E3.
The line item Item Name can be used on a UX board to show the selected item in a KPI.Format Formula Summary Applies To SYS06 E3 Energy Sources E3 Energy Sources Item List, E3 ITEM('E3 Energy Sources') None - Code Text CODE(ITEM('E3 Energy Sources')) Formula - Parent E2 List, E2 PARENT(Item) 1st non blank - Parent E2 Text Text NAME('Parent E2') 1st non blank - Grandparent E1 List, E1 PARENT('Parent E2') 1st non blank - Grandparent E1 Text Text NAME('Grandparent E1') 1st non blank - -- Level and Name Items -- None - Count Number 1 Sum - Is E3? Boolean TRUE None - Is E2? Boolean NAME(ITEM('E3 Energy Sources')) = 'Parent E2 Text' AND NOT 'Is E1?' Formula - Is E1? Boolean NAME(ITEM('E3 Energy Sources')) = 'Grandparent E1 Text' Formula - Is Top? Boolean Count = Count[SELECT: 'E1 Energy Classes'.All Energy Sources] Formula - Level Number IF Is Top? THEN 0 ELSE IF 'Is E1?' THEN 1 ELSE IF 'Is E2?' THEN 2 ELSE IF 'Is E3?' THEN 3 ELSE 99999 Formula - Item Name Textt IF Level = 0 THEN NAME('E1 Energy Classes'.All Energy Sources) ELSE IF Level = 1 THEN 'Grandparent E1 Text' ELSE IF Level = 2 THEN 'Parent E2 Text' ELSE NAME(Item) Formula - 1