General Requirement
For a set of measures, end users want to be able to choose any two versions and see the calculated variances between them. They also want to see a visualization in the form of a waterfall chart that explains the difference between the selected versions.
Problem Statement
Let’s say we have a summary measure, EBITDA perhaps, that is made up of 10 component items, and that we have 6 native versions in our model. The user wants to be able to choose any two of those versions and see the variances for each component and a chart showing the bridge between the EBITDA of the first version with that of the second:

Overview
Native versions in Anaplan provide for simple variance calculations between versions, e.g. Actual – Budget. But it is common to have many versions—Actual, Budget, 11 monthly forecasts per year, Scenarios, etc. Adding calculated versions for variances between these is not a good option for the following reasons:
- A lot of needless space would be used in modules where they are not needed.
- Usability is compromised in many cases.
- High maintenance burden.
Variances are often nuanced calculations too. For example, the signage might be different depending on the display protocol of an item in a P&L list, or whether an increase in a value in a list item is deemed to be favorable or unfavorable.
All of the above means that in most cases, variances are handled better and more easily as line items.
Solution
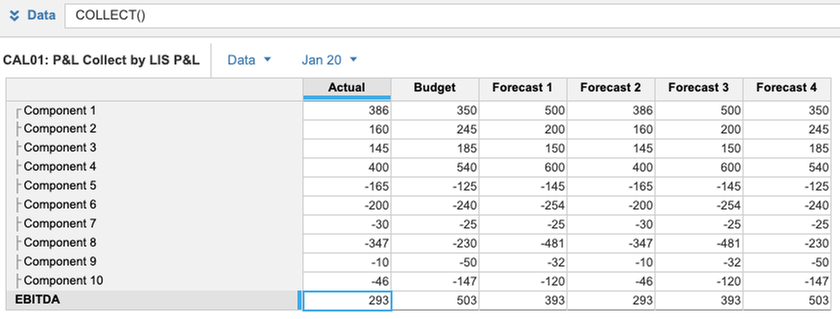
We will have a data module somewhere in our model with the calculated components by time and version (and any other dimensions the module Applies To, such as Cost Centers). Here I have just entered some data manually:

Each component is a line item, as you would expect.
In Anaplan, we can’t have line-item calculations that intersect with one another, so we need to convert the components to lists in order to calculate the versions and the variances as line items. This is necessary to engineer the calculation to be based on end-user version selections.
The first P&L Component list is a Line Item Subset. Mine looks like this:

Now, we need a module to collect the data against this LIS:

At this point, we need to consider the requirement for a user to be able to select any two versions. This feature is best served through the use of list formatted line items so that they can select from dropdown lists:

This is better than offering a Boolean selection because they can only pick one item for each version.
But—it is not possible to format a line item with Native Versions. We need a list that replicates the Versions. A line-item subset will work well here, but we need to model a way to calculate the versions as line items.
Above we have a module by LIS P&L Components and Versions. We need to create LIS Versions, but in Anaplan we can’t dimension a module by more than one Line Item Subset. We, therefore, need a module that uses a normal list for the P&L Components in place of LIS P&L Components. If it does not already exist for other purposes, then the creation/maintenance of this list can be synchronized with LIS P&L Components via a System module.
The new module CAL02: P&L by Component List looks exactly the same:

…but is dimensioned by P&L Components, a normal list, but NOT Versions. This is because the line items represent the versions. You can see the full formula for Forecast 2 in the formula bar above. The formulae for the other line items are identical but for the version names.
You will also see in that formula that I have used a simple Mapping module to map LIS P&L Components to P&L Components, which has a FINDITEM formula to populate it.

I can now build my LIS Versions list to use in my Version Selection module to format for use as a dropdown:

I also need a module dimensioned by LIS Versions to use as a source for my variance calculations. This also needs the P&L Components list since we can’t have two Line Item Subsets in one module:
Again, this looks exactly the same with a simple Collect formula bringing the data through.

Now we are in a position to build our Variance Calculation module, based on user selections:


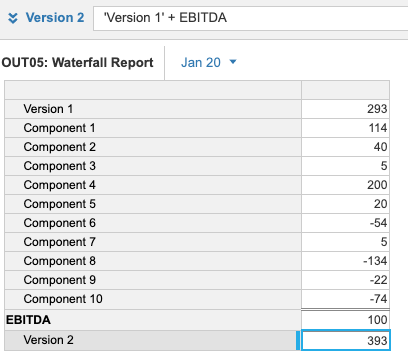
Now we have our variances calculated depending on the versions we select. All good so far. But the variance column by itself does not provide all we need for the waterfall chart. We need to model a SINGLE COLUMN with the EBITDA of Version 1 as the starting point, the variances for each PL Component between versions as the movements, and the EBITDA for Version 2 as the end point.
To do this we need another module, with the components converted back to line items. I created a Waterfall Report module, without Versions.

You will notice that another Mapping module is used as a lookup here to avoid multiple SELECT statements that go against the Planual. The module uses LIS Waterfall:

…and simple Finditem to populate:

Now we have our start and end values, bookending the movements that bridge between them, in a single column:

This is all we need for our Waterfall chart:

Now, if you think that you will have many users wanting to make different selections while using this feature simultaneously, then you might need to add the Users list to the Version Selection Module, the CAL04: Variance Calculation module, and the OUT05: Waterfall Report module. Take care though, as this might have sizing implications.