Before diving in, if you need to refresh your memory on what PlanIQ is, click here.
In order to forecast forward based on historical data, the algorithms within PlanIQ require a module in Anaplan made up of a minimum of the following:
- a list of items to forecast against (e.g., SKU by Store),
- a list of time periods containing the history
- the data or measure to be forecast (e.g. sales volumes)
This article focuses on the creation of the Item ID list. When combined in a module with a time dimension and a line item for the data, it provides all the data points needed for the algorithms to work on. It can be made up of elements from a single business dimension, such as SKU. More likely, however, is that it is a combination of two or more independent business dimensions, such as SKU by Store, or Product by Channel by Customer. PlanIQ requires the Item IDs to be a single list of relevant data points to forecast, created by concatenating those valid combinations.
What is the best practice for concatenation in Anaplan?
There are 2 possibilities at this stage:
- Generate the list in a source system or database, and import it directly into Anaplan. This is the simplest solution and applies the least burden on the Anaplan calculation engine.
- Leverage historical data to identify valid combinations. This article will walk you through the steps.
Historical transactions may held be in a sparse module which is dimensioned by key attributes such as Product and Customer. Alternatively, they may be held in a dense module dimensioned by a generic list (transaction ids) with key attributes such as Product and Customer as line items. We will look at both examples.
Concatenation is a function that manipulates text. Text is “expensive” in Anaplan, in terms of memory. Formulas calculating text can be a drain on performance over large lists and data sets. We are recommending the following best practice to minimize the time taken to calculate the text you need to create your concatenated lists.
Step-by-step overview
Let’s consider the first example of a data module with historical data dimensioned by Customer and Product by Month.
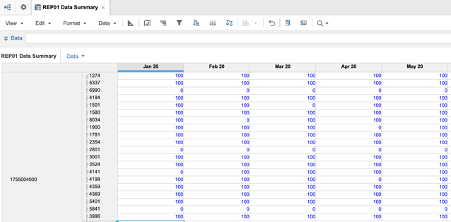
For simplicity we’ll just look at codes. The customer code is 10 digits and numeric, the product code is numeric or alphanumeric and of variable length. We have 3,532 items in the Product list, and 2,254 in the Customers list. Combined with 3 years of months and we have a line item with over 318m cells.
We will demonstrate 4 levels of efficiency in the concatenation formula.
Level 1 – code inefficient
Now, we could calculate a concatenated code by adding a text formatted line item in this module as follows:
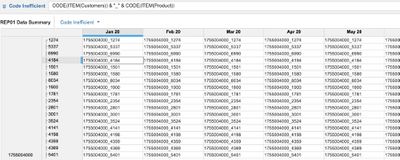
There are two concatenations here because we are adding an underscore as a delimiter, but you can add any delimiter you want. This is very inefficient in such a large module.
Ok, subtotals are off, so we are down to 286m cells:

But the engine is calculating each concatenation 286m times, with the same results being repeated many times.
There is an important adage when it comes to modeling in Anaplan:
"Calculate once, reference many times" - (see The Zen of Anaplan for more details)
In other words, it is much quicker for the engine to pick up a result that is already calculated and reference it, than to calculate it again.
Level 2 – code better
To avoid the repetitions, let’s split the Customer and Product calculations into System Modules (one for each). System modules are an important construct in out recommended DISCO methodology for building models. For more details about DISCO, check out this link.
The cell counts for each line item are 2,254 and 3,532 respectively, a total of 5,786 calculations, far lower than the previous option.
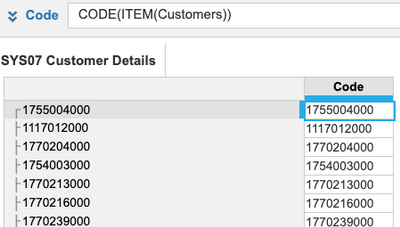
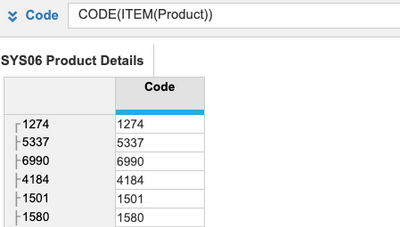
Back in our transaction module, we can use a more optimal formula like this:

Most of the formula is referencing, not calculating, the customer and product codes. However, the underscore is still being “calculated” 286m times.
Level 3 – Code to use
We can improve this by creating a tiny module (3 cells here, one for each of 3 different kinds of delimiter) containing the underscore

….and then referencing this in the Customer Sys module to concatenate it to Customers (smaller list than products):
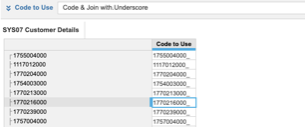
The underscore is calculated once only, then referenced first in the Customer Sys module and from there back in the transactions module as follows:
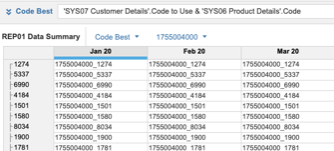
Level 4 – Optimized code to use
But there is one more glaring inefficiency here. The codes do not vary with time. Let’s create a module without time.
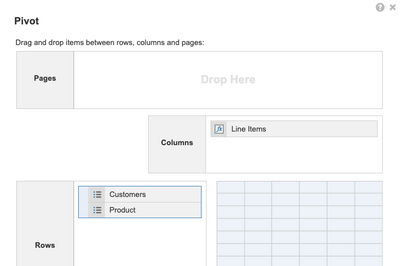
The formula for the Item_ID is the same. Pivoted like this, the view can be used as the source for creating your Target Time Series (TTS) list of Item IDs.
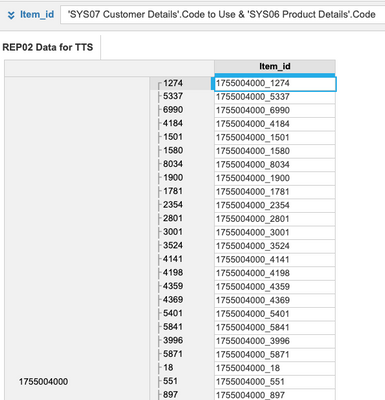
However, there is one more thing we should do here. You can see that the transaction module has sparsity, meaning that there are combinations of Customers and Products with no data. You can eliminate these by introducing a condition to the formula to blank out codes with no data associated with them.
Blanks now appear where the data totals zero across all periods. Note that SELECT:Time.All Periods is one of the few accepted uses of the Select function per the Planual.
Add a filter to eliminate these from the view. Save the view to use as a source for importing into the Target Time Series list.

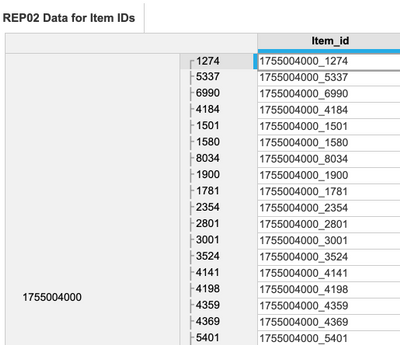
Below is the list as created from this saved view. Notice the absence of 1755004000_6990 in the final Item_ID list here, since there is no data for this combination…
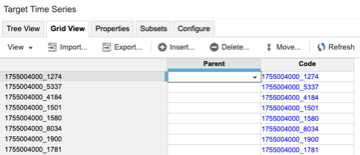
Now let’s look at the second type of transaction module, based on a list of transactions.
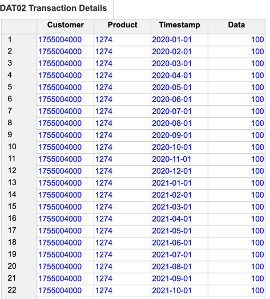
By definition this is a much more dense module than the previous one, since there would not be a transaction for an invalid combination of product and customer. It is also smaller for the same reason. To derive our Item ID list, we could simply add a single line item to do the concatenation like this:
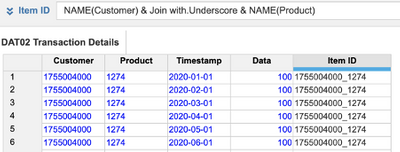
But of course, as you can see, the result is repeated for every time period. This would still work as a source for the Item ID list but the import would perform more slowly while it wrote error logs for all the duplications. Better is to add another line item to use as a filter to eliminate the duplications at source. This is a Boolean item which uses the ISFIRSTOCCURENCE function to highlight just one occurrence of each combination.

Apply the filter to just include the distinct combinations:

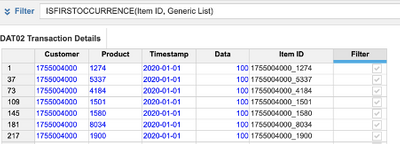
Then save a view to use as the source for building the Item_ID list:
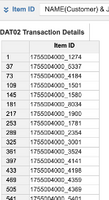
So, we have looked at a couple of examples for creating our Item ID list by concatenating independent dimensions. Ultimately, PlanIQ will return the results from the forecast it generates into a results module dimensioned by the same Item ID list.
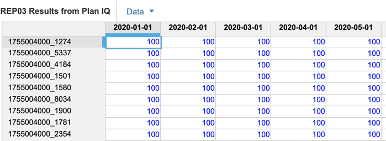
We almost certainly need to “de-concatenate” these results into a dimensionalized module for downstream use and reporting in Anaplan. For that we need a SYS module based on the Item ID list, which maps the Items to Product and Customer separately.
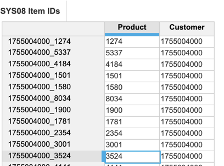
You can see from the blueprint of the SYS module how this is achieved with simple FINDITEM formulae.

We also need a mapping of the Timestamp list used by PlanIQ to the Anaplan native timescale. This is done in a SYS module related to Time:

The blueprint for this SYS module is given here:

Now we can construct a module with Anaplan time, Product and Customer as follows:
Job done!
By leveraging these best practices, you will make the most of PlanIQ forecasting capabilities and your performance will be optimized!
How do we handle items with limited to no history?
Adding “Cold Start” Items
We can use PlanIQ to produce forecasts for which no history exists. A deeper dive article on cold starts is available here. For the purpose of this article, we just focus on how to add such an item to the concatenated list.
We will assume that both the customer and product already exist in the data hub. If either or both are completely new, they will have been created in the source system and loaded into Anaplan. Alternatively, it could just be that we have never sold a particular product to an existing customer before.
Build a simple module without time or versions, dimensioned by a generic list, with line items as per this blueprint:

The module view looks like this:
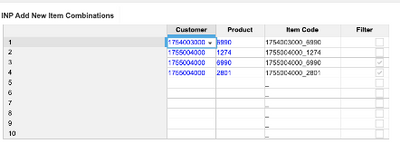
The Item Code is constructed, and a filter column records TRUE when the item does not yet exist in the ITEM ID list.
If we look at the data module, we can see that there is no data for those two items, which makes sense as the concatenation would not have been created by the process detailed above.
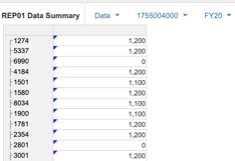
Apply the filter and hide all columns except for the Item Code. Save as a view to use to import to the Item ID list.

Now create an import action to the Item ID list, using this view as the source. Once you run this, notice that the filter has now been cleared, because the items now exist:

You should then build an action to clear this module out to be used again in the next forecast cycle.
Got feedback on this content? Let us know in the comments below.
Contributing authors: Nitzan Paz, Christophe Keomanivong, Frankie Wolf, Timothy Brennan, Andrew Martin, Evgenya Kontorovich, and AJ Balsamo.