I have a data set where I am using Stacked Columns to show a build-up of a number. I have now added Versions to this Module. I want to be able to see two sets of stacked columns, one for each version.
Here is the current result:

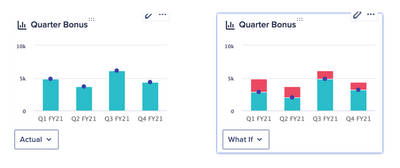
And here is the Actual and What If Versions, each as their own chart:

Finally, here is the (mocked up) result I am looking for:

This would be accomplished by the PB selecting which Dimension to Stack by: Line Items or Versions. Here the selection would be Line Items.