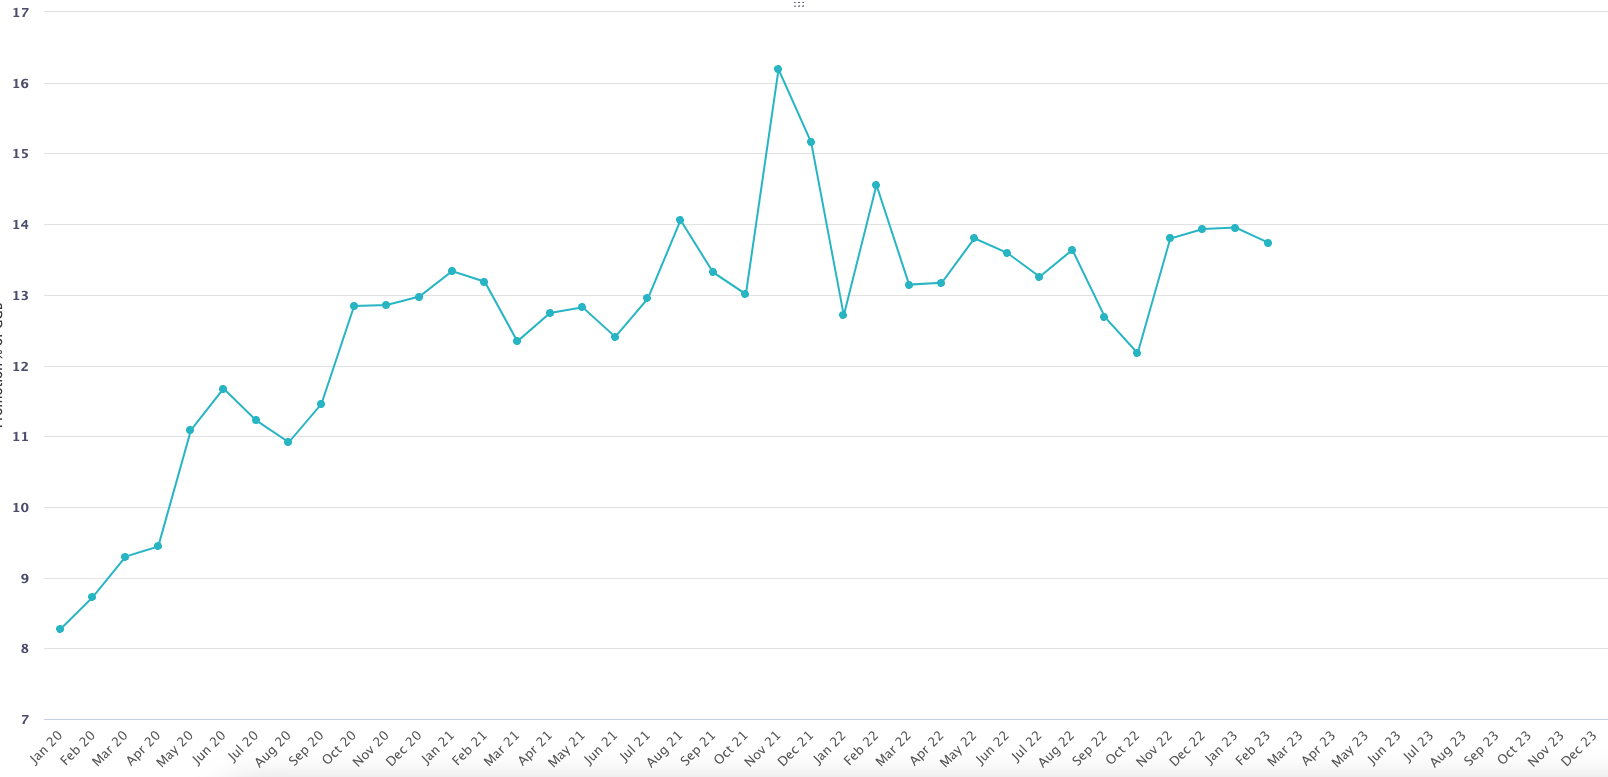
Seems like in the New UX graphs and charts axis's can be scaled if the axis is a line item. However, there should be an option to scale any axis even if it is a dimension especially Time. For example, daily data would look neater and present better on presentations/decks if the time scale could be reduced to show SOME time points (Jan'19, Apr'19, Jul'19, Oct'19) and have the graph map all data points but only surface some of the Time months versus all of them. Has anyone found a way around this? this is something you can easily do in google sheets