I would like the ability to add a dynamic subtotal to a grid, so when rows are filtered out the total is updated on the fly
Yes, we need to have dynamic summary totals that adjust based on filters and selective access. To work around this, we have to create new modules and line itmes that create redundancy and inefficiencies in the model. In some cases, there is no way to work around this issue and sumary totals must be hidden. This is a major issue for my clients.
This is definitely a major improvement to the grid that is requested by almost all my customers.
This is also a major issue for my customers. Many of them have requested a total based on what they can see through filters/selective access.
Does this exist? I find it extremely painful that this basic functionality is not intuitive.
This would save so much time and is useful for most customers
Hello, is there any update on when a solution will be implemented?
I've been asking this since we started with Anaplan in 2021
YES PLEASE !
I think as the hyper-block calculates the summaries at the dimensionality this is not possible (I.e. the list items are summed up at their parent level and the filter is just a view/cut of this).
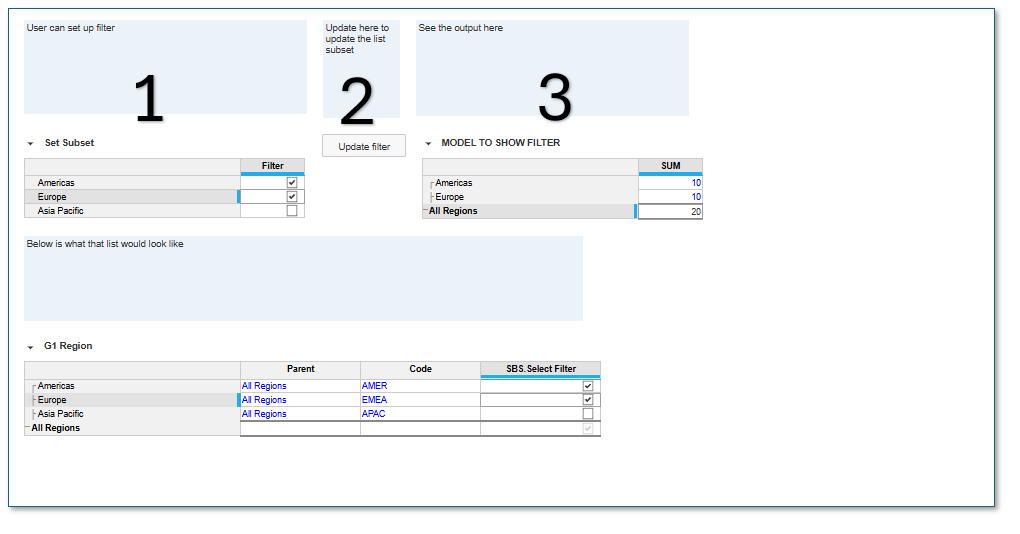
The only way I could suggest doing this is to create a Subset of the list items you want to filter on and then updating that subset with an action. The user can then in effect create a custom "LIST" for their purpose. I hope the below is understandable:
Please note the data in (Table 3) below should be a formula and not data thats been imported as changing the subset removes data (If deselected)
Also if you do set it up as per below the subset would change for all users.
(Although not advisable you can give users access to the the list property that drives the subset and then you wont need the process button)
[Current Issue] The chart below shows the result when Chart → Axis → Label Format = Manual is applied to the vertical axis (see Note 1). In this case, the amounts on the chart’s vertical axis are not displayed with comma separators, which makes them difficult for clients to read and confirm. Amounts displayed on the chart…
[Current Issue] Currently, when bubbles overlap in a bubble chart, the label name of one of the overlapping bubbles is not displayed. For example, as shown below, the blue bubble and the light blue bubble overlap. The label name for the blue bubble is Name A, and the label name for the light blue bubble is Name B. At…
I should not be able to delete any line item that is part of a saved view or used in an action within connected models. With the growing number of interconnected models and imports, any deletion, movement, or renaming of line items can break imports and disrupt connections between models. This safeguard is essential as a…