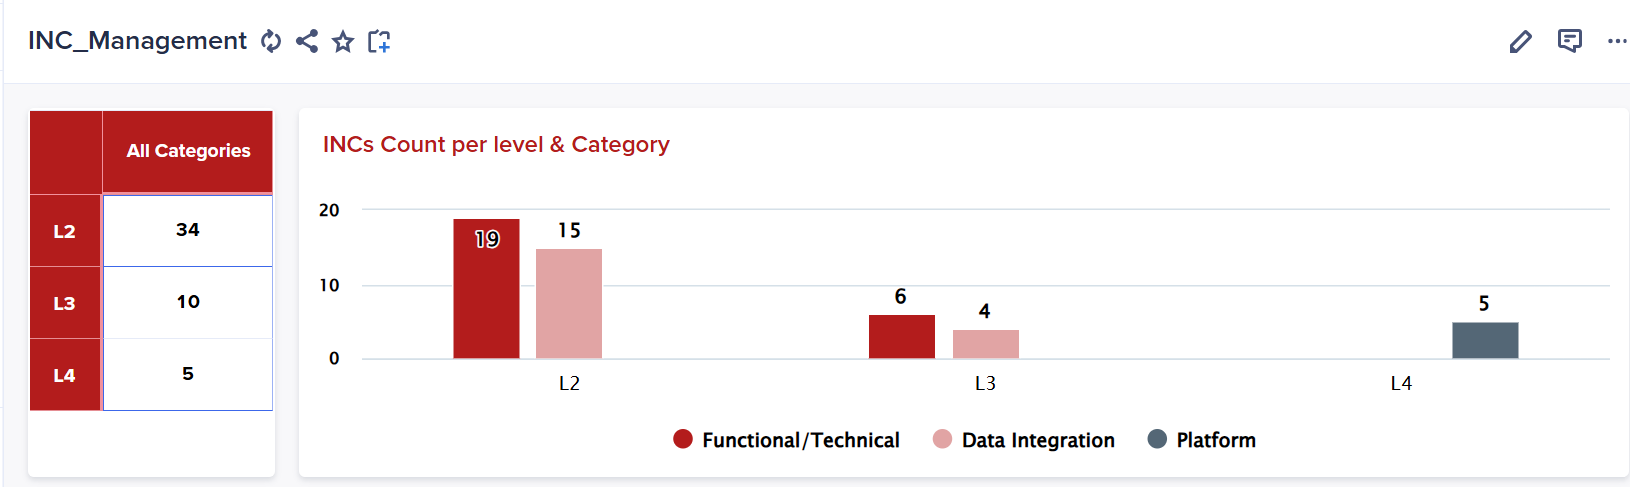
I want to add another coloumn to show percentage for example level 2 % will be equal to 34/total no of inc and so on? how to do that
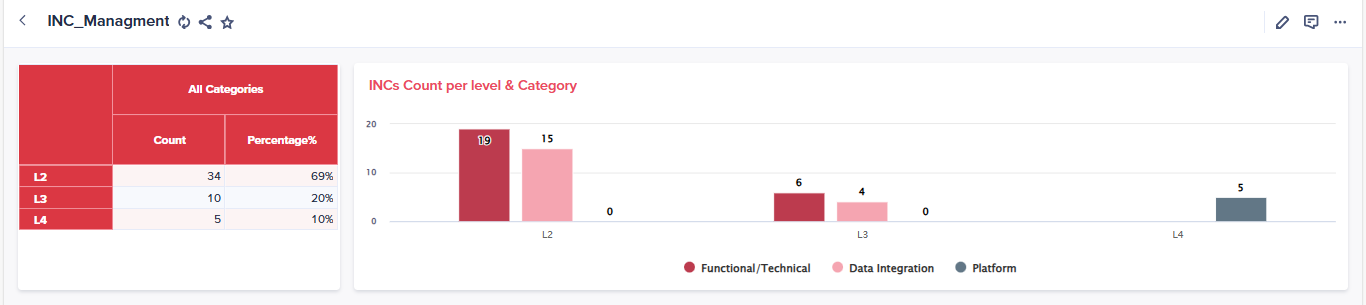
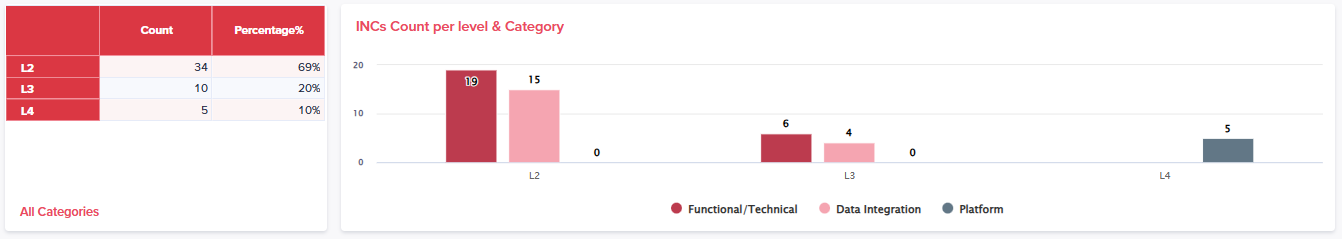
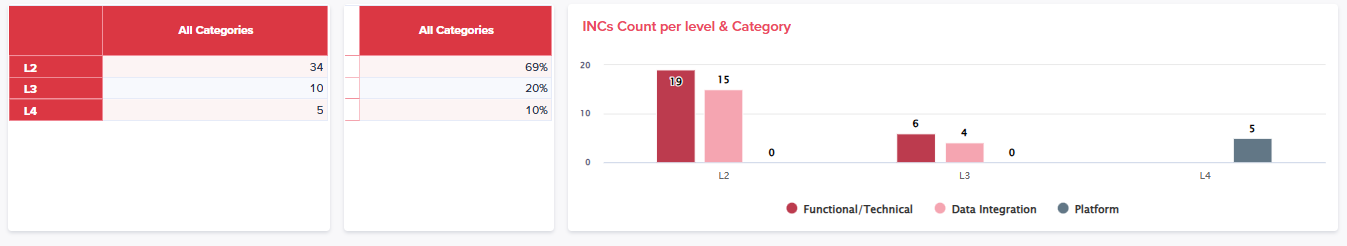
Assuming the grid has two list dimensions and a line item as a selector, I created a backend solution where a summary is generated using the SUM function across both lists. This summary is then referenced in a system module. In the main module, I created a line item for percentage calculation by dividing the value by the referenced summary from the system module. The line item is formatted as a percentage. With this setup, the percentage can be correctly displayed in the NUX as required. I’ve attached screenshots of two UX views for reference.
Thanks alot for your feedback @102049
I think I have a problem with the summary system module could you guide me
Glad to help you. To collect summary, just make a line item in the system module and directly refer "Count" line item to that newly created line item (Make sure summary in on in the source module).
Hi ALL, I'm using Product Category, Product Line, and Budget Type to generate a unique Code for a list. The display string is generated as: Product Category & "_" & Budget Type & "_" & Product Line. The Code is currently generated using: LEFT(Display String, 60) The issue is that Product Category and Product Line contains…
Hello everyone, I hope you're doing well. I'm posting because two of my coworkers are trying to use the Anaplan Excel Add-In Series 4, but they're running into an issue during the connection setup process. When they go to New → New Read-Only Connection (or New Connection) and reach the "Select a Customer" step, no…
Why in my model output is blank, after send explainability data.