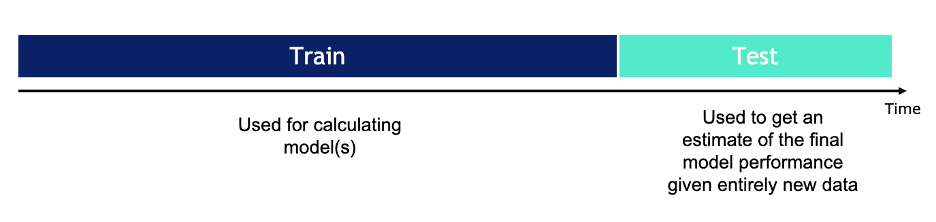
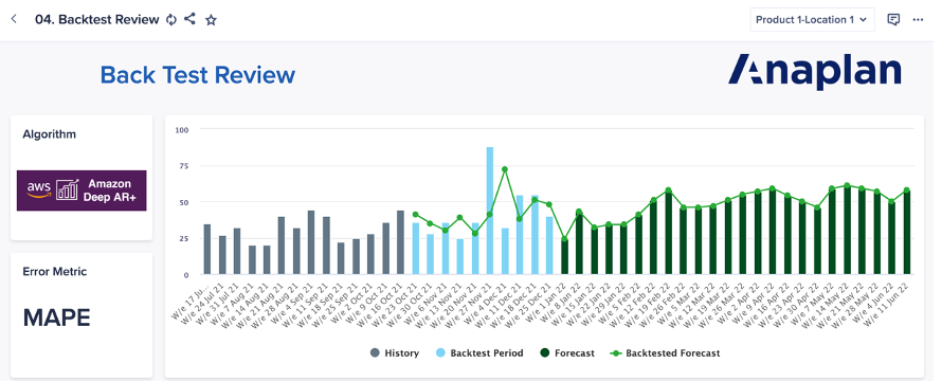
In almost all cases, computing forecast accuracy requires a calculation of the difference between forecast versus actuals. One of the best ways to approximate the future accuracy of the forecast is to use a backtest window. With a backtest window, you can simulate “what if” you had run a Forecaster forecast with the data available at an earlier point in time.
Note: You have the option to 1) use the automatically-generated backtest results exported from Forecaster, or 2) build a custom process to evaluate forecast performance. The following sections describe how and when to use either approach.
Out of the box: Forecaster automated backtest period and accuracy metrics
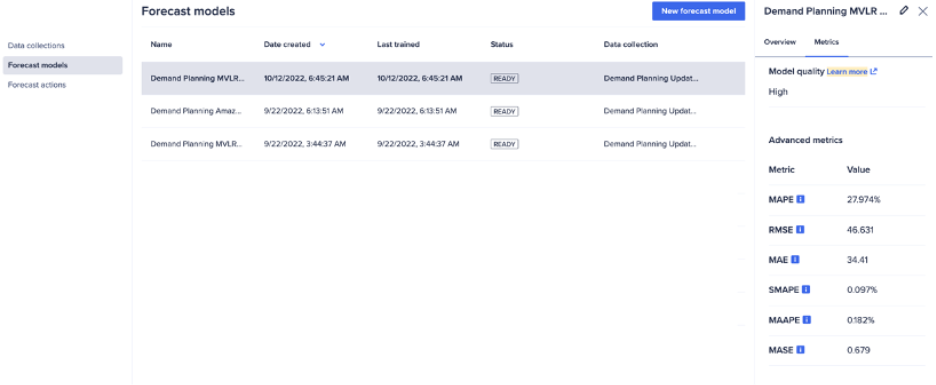
Forecaster automatically generates some forecast accuracy metrics as soon as you build a forecast model. The automated metrics are there to help quickly check overall accuracy, especially when building multiple forecast models in succession with the same data set. These metrics include RMSE, MAPE, MAE, MAAPE, sMAPe, and MASE, and an overall model quality metric, which are described in more detail in Anapedia Understand Advanced Metrics.
The backtest window for these automatically generated metrics is the length of the Forecaster forecast horizon. The automated metrics are calculated and aggregated across all items and all periods in the backtest window.
However, you likely want to know the accuracy period and item to compare relative performance across items and over time, which is not captured in the automatically generated metrics.
Therefore, it is highly recommended that you calculate these metrics within Anaplan to ensure the forecast performance evaluation is aligned to the business use case, especially if you are dealing with multiple items that may perform differently depending on the underlying data. This way you can ensure the model forecast accuracy is consistent across time periods and items.
To be able to drill down to the forecast performance at the item time period level, you can import the same backtest results that are used to generate the automated accuracy metrics, and then calculate variance between forecast versus actuals (backtest results).
Custom built: User defines back-test window and timeframe
Instead of relying on the automatically-generated backtest results, you may also create your own backtest window and calculate forecast accuracy metrics yourself in Anaplan. There are several reasons to do this. First, you may want to customize the length of the backtest window to be shorter or longer than the automatically-generated results. However, keep in mind we recommend using a backtest window that is the same length as the forecast horizon as a baseline. That way you can evaluate performance across the entire forecast window. Especially if there are major seasonal or cyclical trends that impact business, you should try to capture the full cycle in the backtest window.
Another reason to construct your own backtest window is because the automated back test results are created at the time the model is built and not updated thereafter. Therefore, we recommend that you independently calculate accuracy metrics on an ongoing basis for reporting purposes until the point that you can use the real Forecaster forecast results instead of the backtest simulation results.
After obtaining the backtest results, the next step is to calculate accuracy metrics based on a comparison of forecast versus actuals (backtest results). For more guidance on how to select which accuracy metrics are best suited to the business use case, see Anapedia Understanding Advanced Metrics.
How to build a backtest window for forecast accuracy testing:
- Identify the period that covers important seasonality while still conserving sufficient historical data to forecast; for example, the last year.
- Build a Forecaster module filtered view as if it were a given past date; for example, as if it were a year prior. Save a new export action based on a saved filtered view and create a new Forecaster data collection.
- Move forward in single period increments to simulate a real-world forecast. For example, monthly, quarterly forecasts for the past year, or weekly forecasts over a period.
- You can do this manually by adjusting the saved view referenced by the data collection forecast action.
- Or, you can partially automate this by creating a module that manages a time filter that is referenced in a saved view.
- You can use a similar approach to monitor performance on an ongoing basis.
- Now that you have forecast versus actuals (backtest results), you can compare multiple accuracy metrics.
- Review the different considerations for selecting which accuracy metrics are best suited to your use case. It is ideal to test multiple metrics.
- If possible, translate into real-world units such as quantity or dollar value. This will provide the best approximation of the most likely cost of accuracy for different scenarios.

