Idea description:
As a user creating dual-axis charts, I want to align the zero position and control axis scales, so that the chart is visually consistent and easy to interpret.
Example of enhancement:
I’ll know this is successful when the zero position on both left and right axes can be aligned (even with negative values), and when I can either define axis intervals or synchronize them across both axes.
Benefit / impact:
Currently, when creating dual-axis charts, the zero positions on the left and right axes do not align. Although it is possible to set a minimum value, there is no way to control the axis interval (grid spacing). This results in multiple misaligned horizontal grid lines, making the chart difficult to read and visually confusing.
ex) When a minimum value is set, multiple grid lines are displayed. Minimum value is set at -10
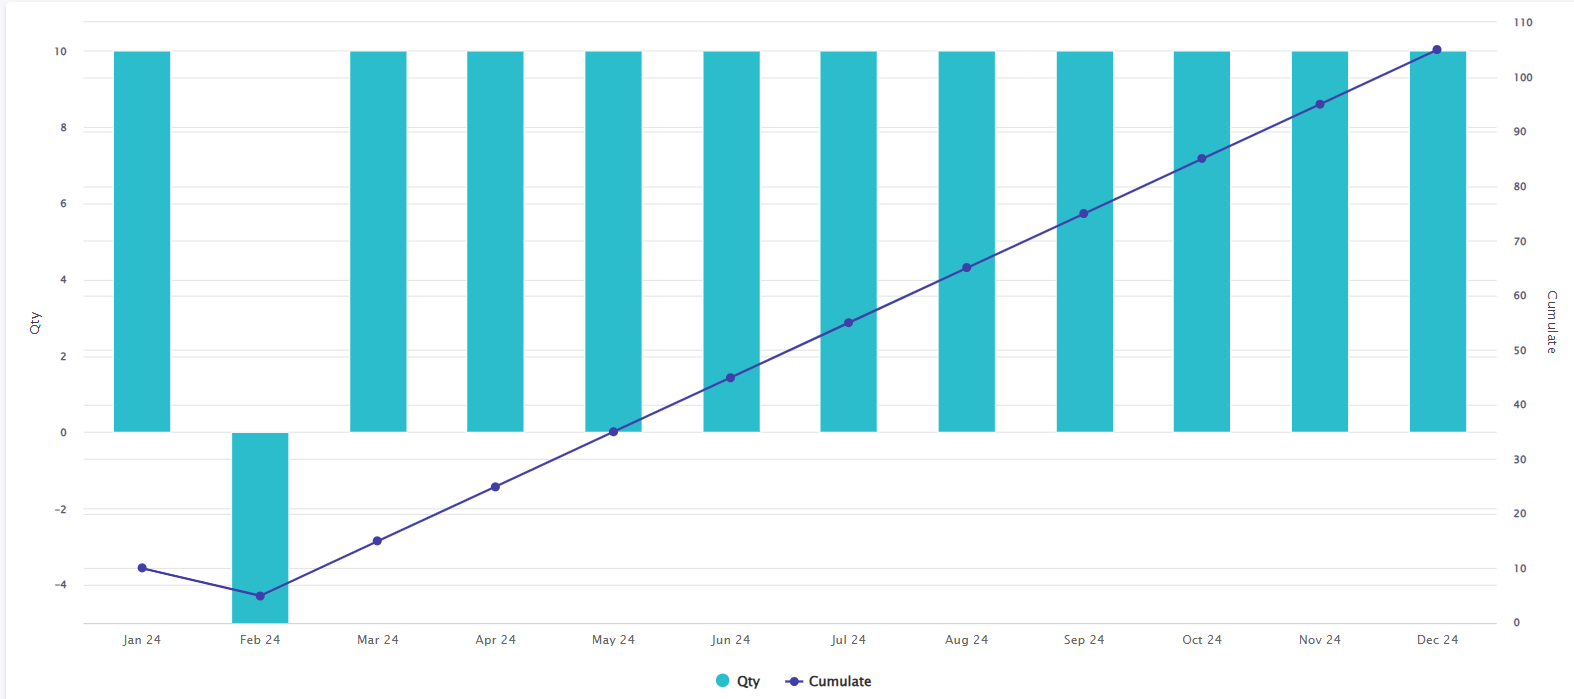
ex) zero position does not align and difficult to understand

Ideal)
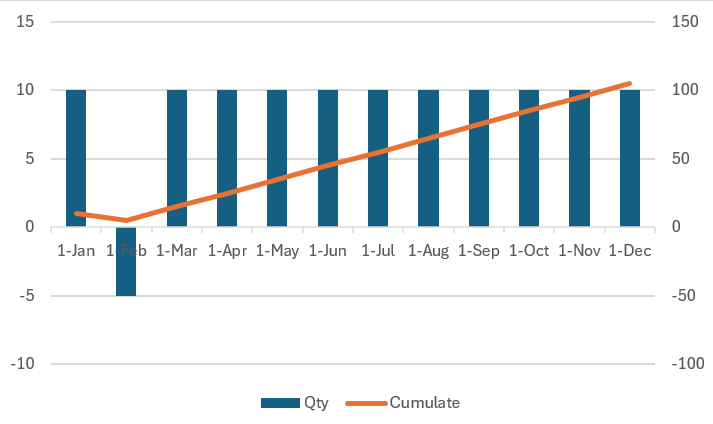
By enabling zero alignment and axis interval control (or synchronization), charts would become clearer, more professional, and easier to compare across metrics, improving overall usability and decision-making efficiency.


