When you have a Gantt chart and you move the mouse over it, it shows the period’s starting and ending dates. It would be great to have the ability to show other custom metrics as well (values, states, ext.)
As is:

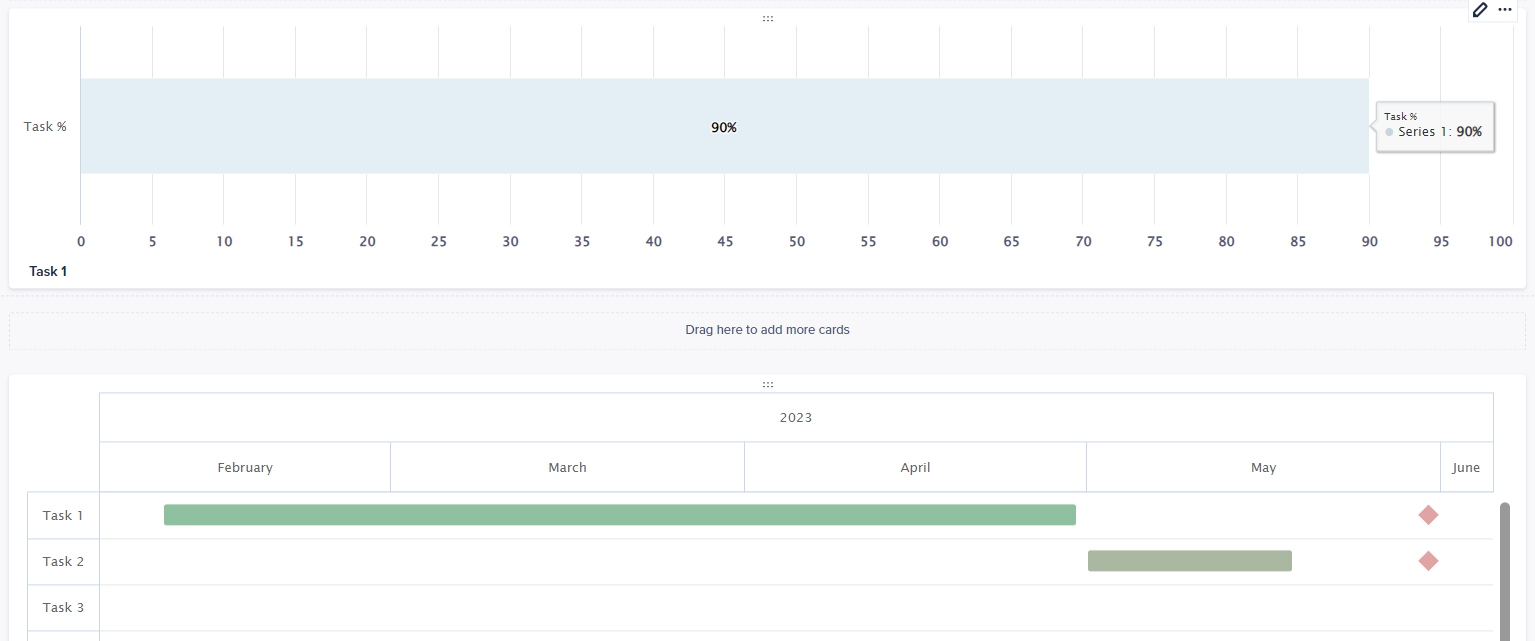
To be something like:

So then number of Line items in tooltips to be flexible and color selectable.