
Author: Aaron Overfors is a Certified Master Anaplanner and Principal Architect at Spaulding Ridge.
A strong user experience is the key to almost every Anaplan solution’s success. A well-designed Anaplan model that scales, performs well, and is easy to maintain will become shelf-ware without a thoughtful, purposeful user experience. In this first of two articles, I will explore the concepts and principles of effective dashboarding, including how to create a strong design prior to the actual construction of the user experience. In part two, we discuss how to execute this design and go over the tactics and approaches to page construction that will power your solution and deliver the value that your end users are looking for.
Concepts
The end goal of the solution design process is to have dashboards and/or exports that fulfill the needs of the business. Knowing that, we can ask questions and tailor structure at every stage of development. The following standards will help deliver a consistent and effective user experience founded on this principle.
Effective dashboarding
Remember that the dashboard is for the end user. The requirements (user stories) should determine the purpose of the dashboards as it is stated in the language of and from the perspective of the main user. It is important to put yourself in their shoes when designing the user experience.
Dashboards should help to make business decisions and plan easily. Remember that the visual layout of your dashboard will facilitate the decision-making process. Some dashboards are intended to be used in presentations while others are meant for high level executive reporting, and many are used to plan for in-depth planning work like projecting sales, units or various other forecasting metrics. Once the dashboards necessary have been determined with requirements, mock up the dashboards.
While mocking up the ideal dashboards, there are many things to take into consideration:
- Will they be able to effectively interact with the dashboard based on what is important to them?
- Does Anaplan offer the dashboarding capabilities/features they are referring to?
- What KPIs are important to them?
- How do they want to interact with those KPIs?
- Do they want to highlight outliers or extreme values?
- If this is a planning dashboard, what view will allow them to quickly and easily assess the impact of their changes?
- Are we putting too much on one dashboard? Is this overloading the end user?
A good dashboard allows users to review information; a great dashboard tells a story and allows users easily to investigate what is important to them.
User experience schema
To solidify the flow between dashboards, creating a user experience schema as a guide can be a highly effective exercise:
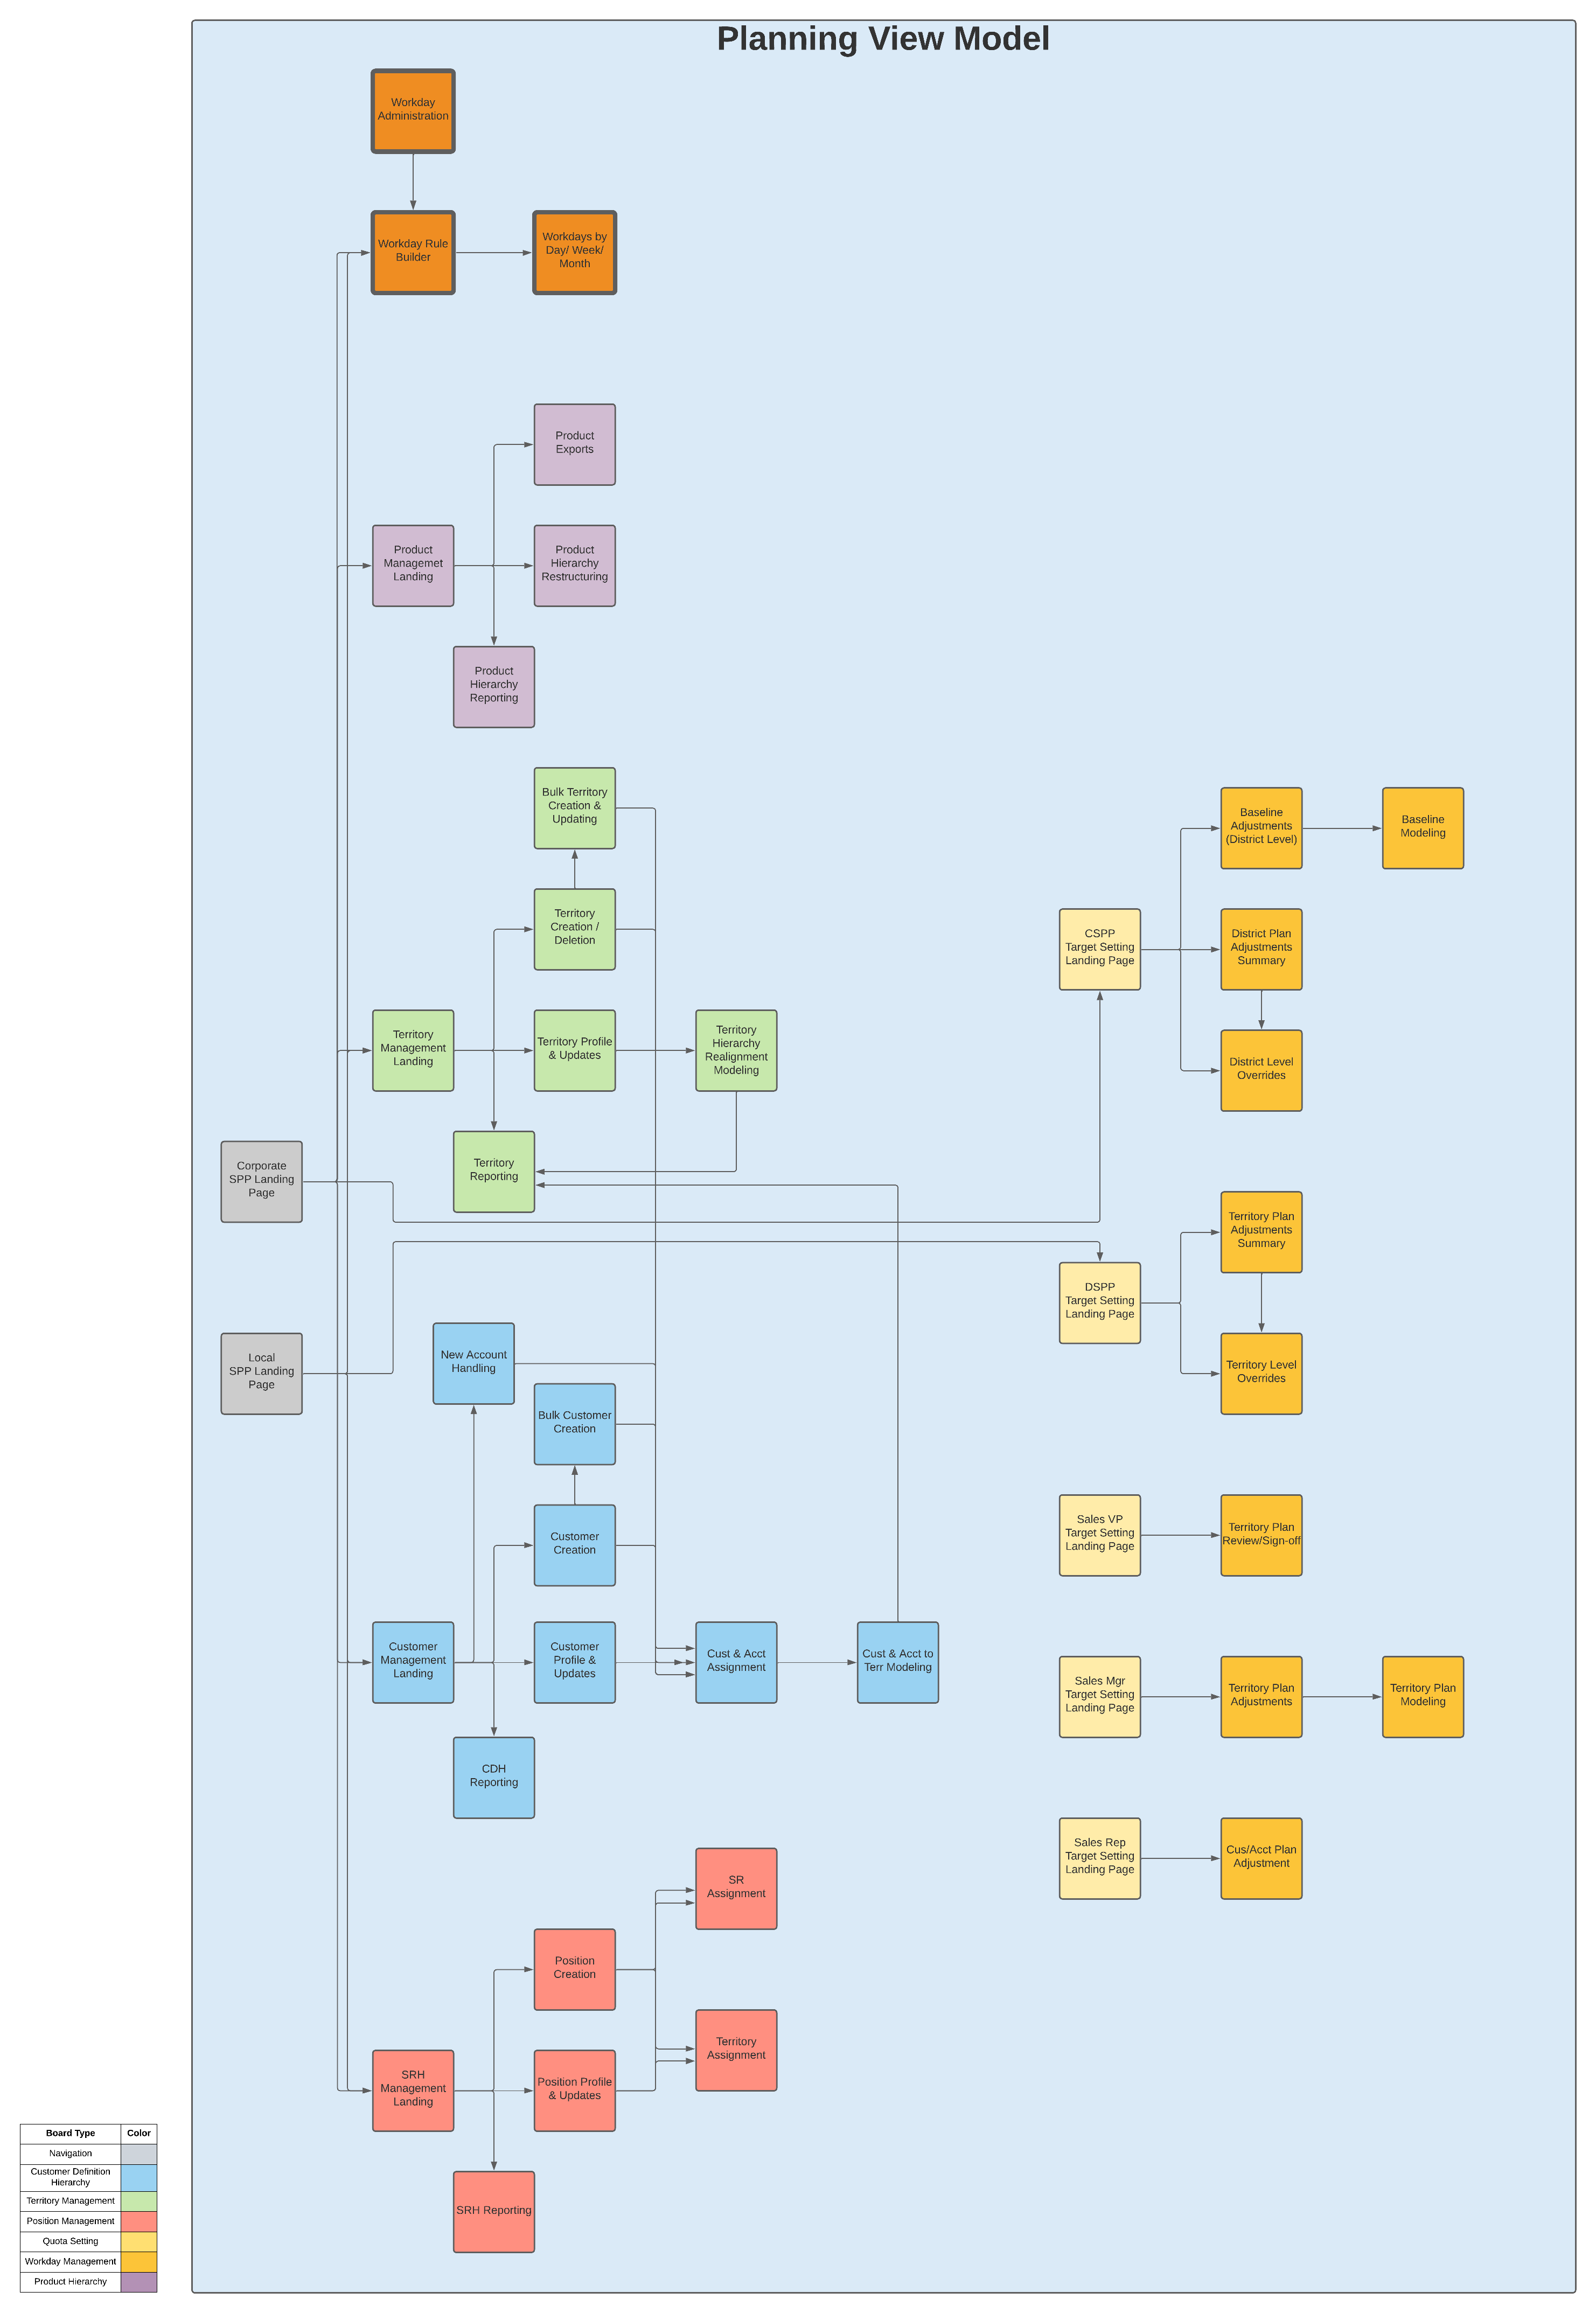
A user experience schema allows you, the designer, to illustrate where functionality will be accomplished in Anaplan prior to constructing it. This is helpful in three main regards:
- You can map your user stories (requirements) to each dashboard to ensure each dashboard has a well-defined purpose, both on its own and in relation to other pages.
- You can ensure each user story is represented in some form or fashion in the user experience.
- You can pressure test the user experience design with your primary stakeholders to ensure the flow is natural and accounts for a regular business rhythm, including if multiple types of users plan to access a single page.
Apps and user roles
On the note of multiple user types, it is important to consider user roles and apps. Apps allow you to create collections of pages that cross multiple models and workspaces, so the way a user experience is built by user role can be more focused on workflows rather than model functionality. Are there distinct enough workflows with little overlap in page use that will warrant setting up multiple apps for this use case? If not, one single app with page restrictions by user role is likely the best option.
UX page types
Resource: Use apps and pages in the User Experience - Anaplan Technical Documentation
New UX page types
- The User Experience (UX) contains three page types: worksheets, boards, and reports.
- Worksheets pages present a single large grid where data can be viewed or edited and additional supplemental cards can be nested to run actions or explain details.
- Board pages provide an overview of multiple cards which can help users visualize data through multiple formats of charts, images, KPIs, grid cards, and more.
- Report pages enable builders to create consistently-styled reports that allow managers and internal stakeholders to access key insights.
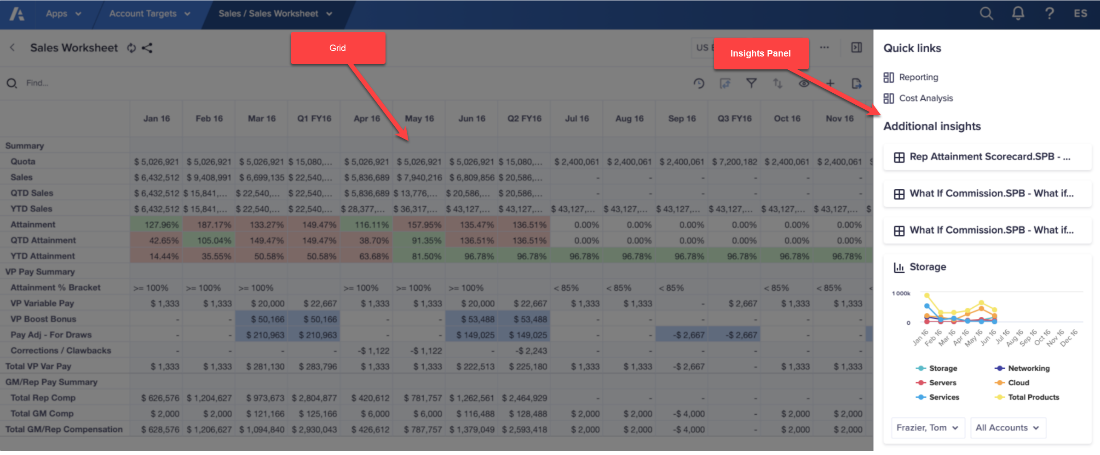
Worksheets
- Worksheets display detailed data from Anaplan models on interactive grids. Worksheets can be used for deep dives into a single source of data for analyzing/editing data from one single module.
- The insights panel located to the right-hand side of the worksheet allows the addition of editable grid cards, instructions, or actions.
Boards
- Boards offer a solution for displaying data from multiple grids/modules. All well-designed boards contain multiple grid cards that relate to one another in an end users process.
- An effective board allows end users to view or edit data displayed on the cards and to interact with the grids to change drivers or assumptions.
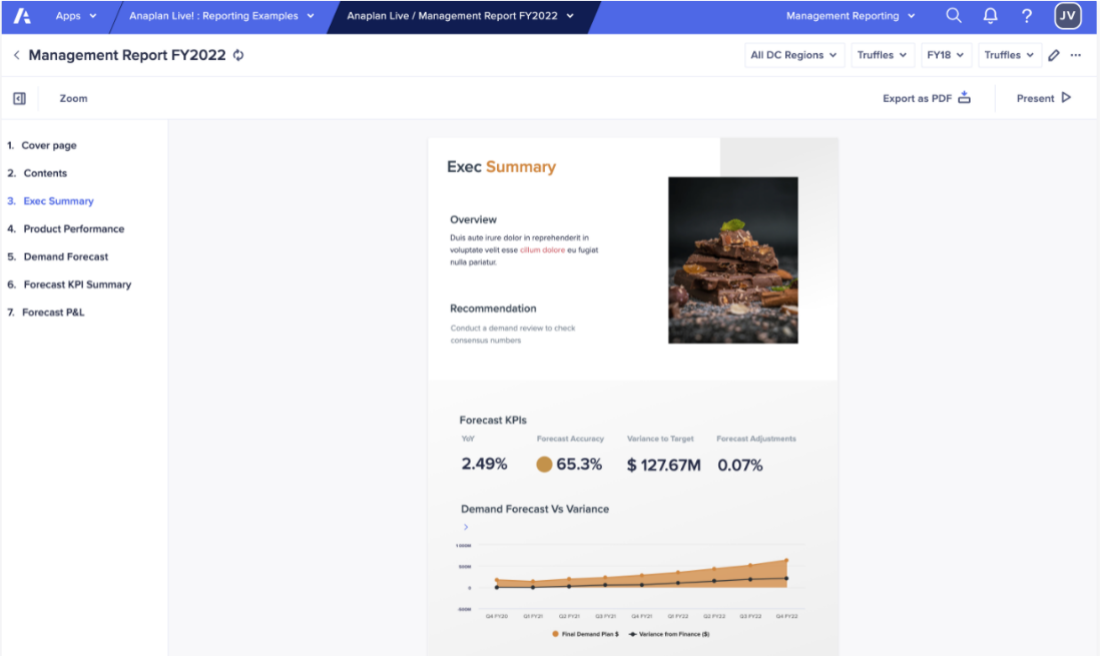
Reports
- Reports are effective at presenting visualizations of relevant data that enables end users to clearly gain insights.
- Reports offer structured sets of slides with robust formatting options to lay out data in the most effective manner. A drawback of reports is that data cannot be edited.
Which reporting capability should I use?
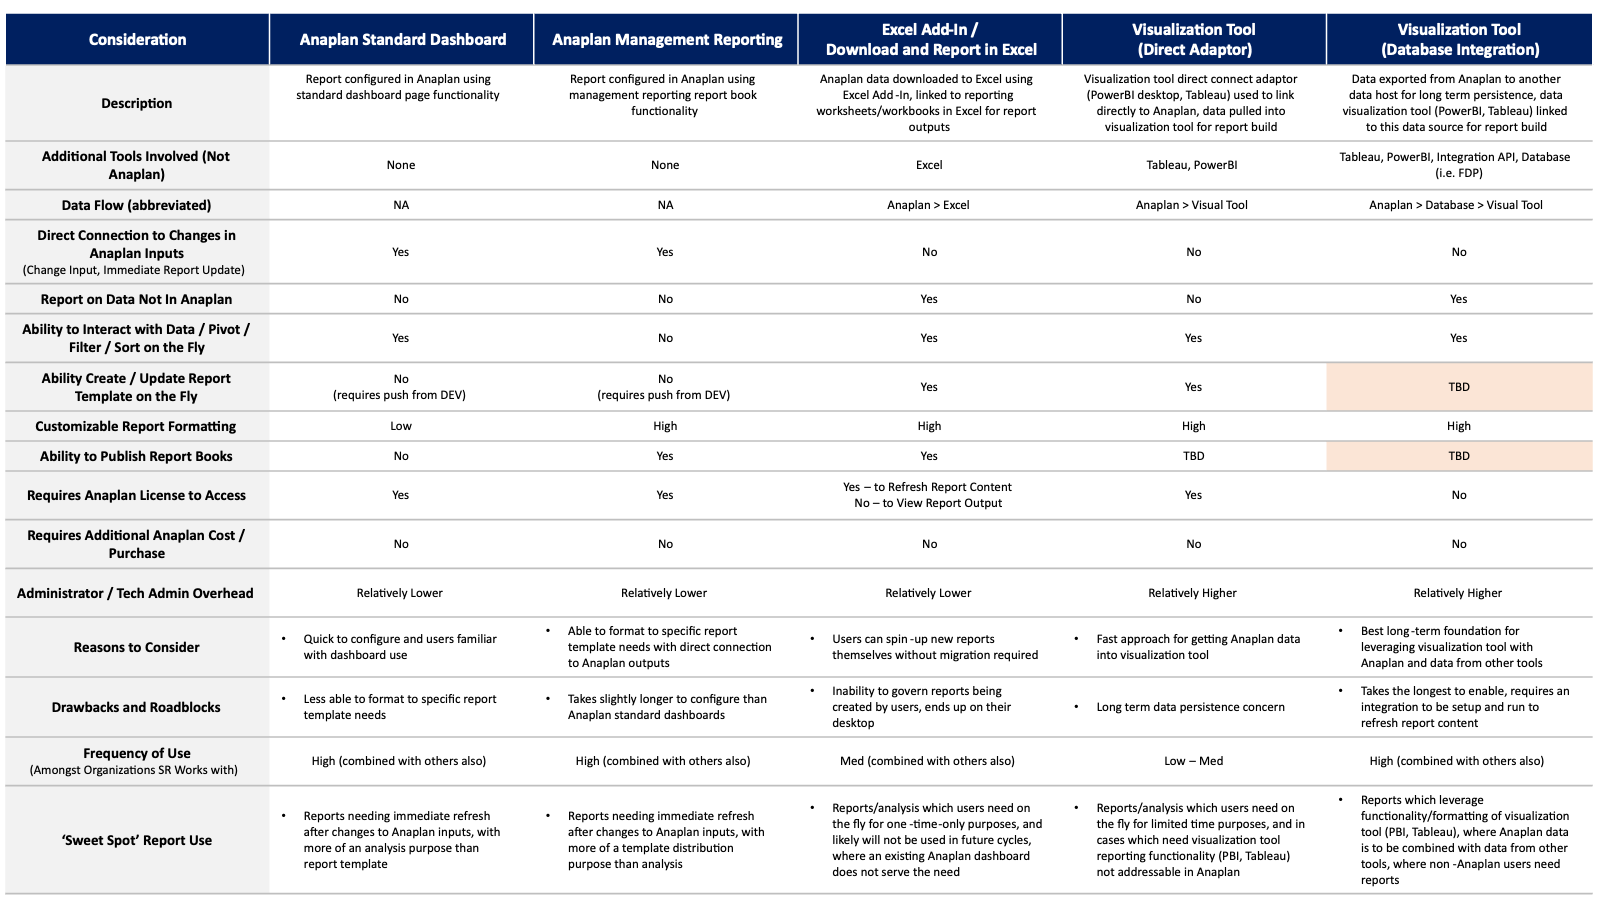
View a larger version of this image here:
‘Reporting’ often refers to providing a static view of data. Special design is needed to achieve this in Anaplan as it is not natively built for it; other tools handle strict ‘reporting’ better than Anaplan. A general guideline is that Anaplan is best for displaying data that needs to be routinely interacted with and changed. Other tools may provide advantages on a presentation and visualization front.
Now that we have explored the concepts and design of a robust user experience, our next step will be laying out the standards that help define a great user experience page.
Check out Part 2 here: Design standards for a superior user experience — Part 2: UX page standards
Questions? Leave a comment!