
Author: Marina Ketelslegers is a Certified Master Anaplanner and FP&A voice for Anaplan and AI passionate about CoE support, solution architecture, and training.
I’ve seen how Anaplan Centers of Excellence (CoEs) start with strong momentum. There’s enthusiasm, executive support, and a clear ambition to make connected planning work across the organization.
And yet, after the first implementations, many CoEs slow down. They become busy, but not necessarily more effective.
In my experience, the issue is rarely the platform or the people. More often, it’s the way metrics are used. Adoption numbers, incident counts, and delivery statistics are tracked, but they exist in isolation. They describe what happened, without clearly showing what the CoE can influence next or how to improve.
What’s usually missing is a consistent metrics system, one that distinguishes leading metrics from outcomes, and that makes the connections between them explicit. Metrics the CoE can actively impact, and that clearly show how design choices, enablement efforts, and prioritization decisions translate into adoption, platform health, and business value.
Anaplan makes this especially interesting. It is a software platform, but it’s also deeply business-owned. Many of the decisions that drive value, how models are designed, how users are enabled, how scenarios are used, sit much closer to the business than in traditional IT systems. That means metrics are not just something to report on; they are a practical tool to guide decisions that directly affect value and ROI.
What I recommend to my clients is not more metrics, but better-connected ones. A combination of quantitative and qualitative indicators, used as a system, that evolves as the CoE matures and helps teams move out of the “stuck” phase into sustained impact.
To support CoEs on this journey I personally think that there is no better tool then Anaplan itself. The four-lens CoE metrics framework is built around this idea. It looks at a CoE from four perspectives that naturally belong together: adoption and user experience, platform health, business value, and the operating health of the CoE itself. Each lens captures a different dimension of success, and none of them tells the full story on its own.
I break it down below, and also take a look at my video walk-through here — How I Built It: Center of Excellence App.
The four lenses of a CoE metrics system

- Adoption and user experience: Are people actually using Anaplan to run their planning process, not just logging in? This lens moves from surface metrics (“who logged in”) to signals that users can complete tasks, run scenarios, and work independently with confidence.
- Platform health: Can the platform reliably support that usage as it scales? Stability, performance, data quality, and integrations all shape user trust. When platform health erodes, adoption will follow, regardless of how good the original design or intent was.
- Business value: Is Anaplan changing how decisions are made? Shorter cycles, better forecast accuracy, faster scenarios, and reduced manual work confirm that the CoE is converting adoption into tangible impact, operational and financial.
- CoE operating health: Is the CoE itself set up to sustain and grow value? Capacity, prioritization, governance, enablement, and partner dependency determine whether the CoE can keep up with demand and invest proactively instead of firefighting.
No single lens tells the full story. Adoption, in my mind, is usually the primary driver of value, but it depends heavily on platform health and CoE operating health. In a good CoE, this forms a reinforcing loop: growing adoption → more pressure → robust platform and governance absorb that pressure → better experiences → deeper adoption → more value.
Maturity: How to read the same metrics over time
The same metric can mean very different things at different maturity stages, so it’s vital to pair the 4 lenses with a simple Foundational → Performance → Strategic maturity model:
- Foundational CoE: Focus on stability and clarity.
Metrics: “Are people using the platform at all?”, “Are high-severity incidents under control?”, “Is basic governance happening regularly?” Fluctuation is normal.
- Performance CoE: Focus on efficiency and scalability.
Metrics: “Where are bottlenecks in UX and delivery?”, “Is demand manageable?”, “Are we reducing dependency on the CoE through self-service and enablement?”
- Strategic CoE: Embedded in how the business plans and decides.
Broad adoption is assumed. The focus shifts to decision quality, scenario agility, realized value, and continuous evolution of planning capabilities.
Seen together, the lenses give you the structure, and maturity gives you the time dimension. This keeps metrics directional instead of becoming unrealistic targets that demotivate teams.
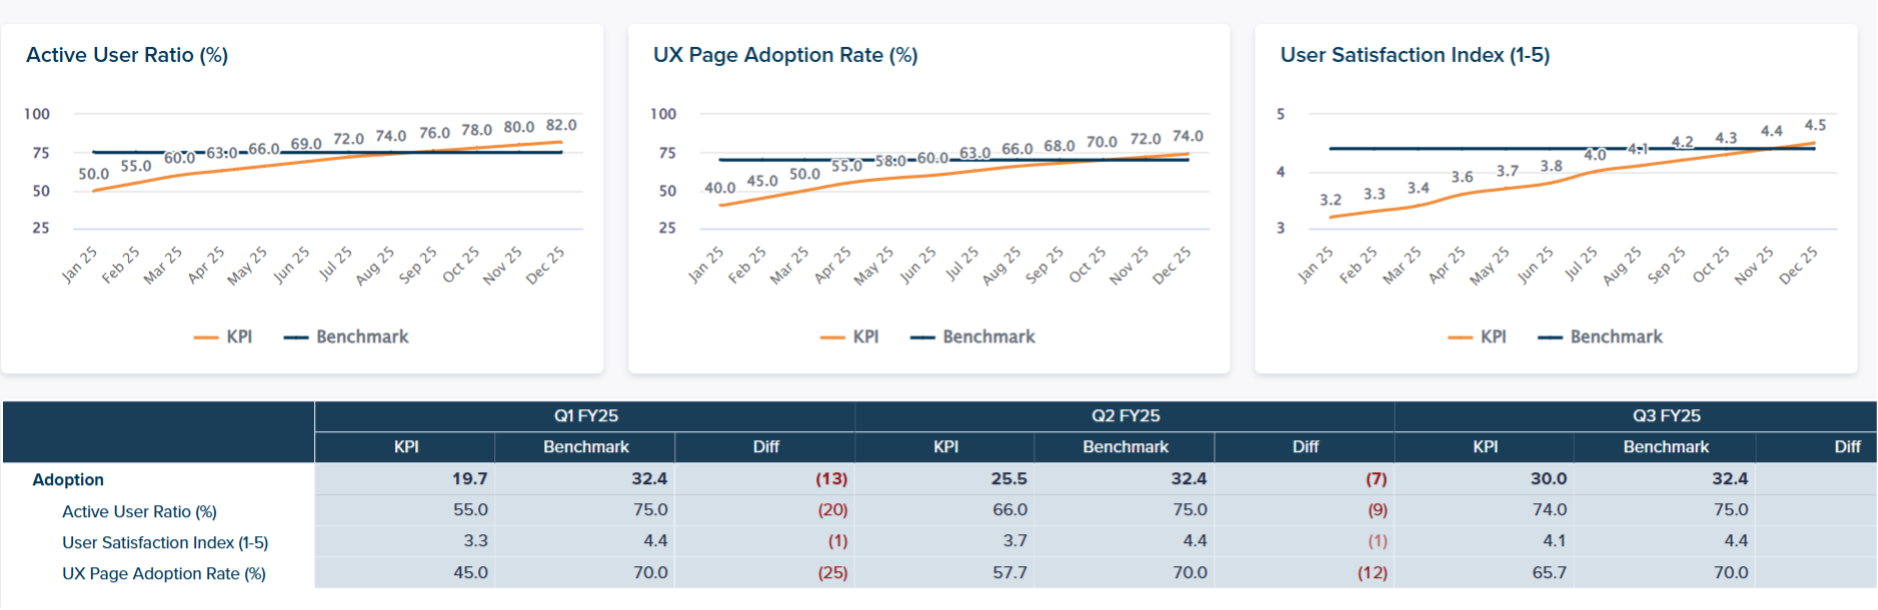
Adoption metrics: Beyond “who logged in”
First, get your technical foundation right: if you want to go beyond counts of logins, enable Anaplan Audit, assign Tenant Auditor access, and set up a way to store audit history (external store or reporting model) due to limited retention.
Read more here: Anapedia | Audit
- Active User Ratio (%) – Foundational
- Question: Is the intended user base actually using Anaplan?
- Formula:
Unique active users in period ÷ Licensed users in scope × 100
- Why it matters: If the right personas aren’t active, planning continues in spreadsheets and shadow processes. As Active User Ratio rises, you typically see more process completion in Anaplan, fewer offline reconciliations, and the first visible cycle time and effort reductions.
- Data: Audit logs + user/license data.
- User Satisfaction Index (1–5) – Performance
- Question: Do users trust Anaplan and find it useful?
- Method: Structured survey with a stable 1–5 scale; track by process/region/persona.
- Why it matters: Satisfaction is a leading indicator. Higher scores usually correlate with fewer workarounds, more consistent execution, and fewer repetitive support queries. Over time, that stability supports better forecast accuracy and scenario agility.
- Data: Survey results stored/visualized in Anaplan.
- UX Page Adoption Rate (%) – Strategic
- Question: Are users following the UX journeys you designed?
- Formula:
Unique users opening a specific UX page ÷ Active users in scope × 100
- Why it matters: High page adoption means users follow standardized paths, which reduces variance, training effort, and friction. Low adoption explains why value stalls even when people “log in”: they avoid key pages and revert to offline steps. Improving page adoption is one of the most direct levers a mature CoE has to unlock more value.
- Data: Audit logs with UX page events.
Platform health metrics: Trust in the foundation

- Incident Volume (High Severity) – Foundational
- Question: Is the platform safe to depend on during critical cycles?
- Definition: Count of incidents in period with “high” severity (e.g., Sev 1–2), optionally split by cause (integration/model/access/performance).
- Why it matters: High-severity incidents quickly destroy trust and drive users to offline workarounds. They typically show up as drops in satisfaction and UX Page Adoption.
- Data: ITSM/ticketing (ServiceNow, Jira, etc.), stored/visualized in Anaplan.
- Integration Reliability Score (%) – Performance
- Question: Do data refreshes deliver on time and without errors?
- Formula:
Successful runs ÷ Total scheduled runs × 100
where “successful” = error-free and on-time.
- Why it matters: If data is late or wrong, the platform might be technically “up” but the process is broken. That erodes trust and adoption even if models are well designed.
- Data: Integration platform logs (Boomi, ADF, CloudWorks, etc.), stored/visualized in Anaplan.
- New Use Case Stabilization Time (days) – Strategic
- Question: How fast do new models move from “launch turbulence” to steady state?
- Method:
- Define a platform baseline ticket rate (average weekly tickets for mature models over last N weeks).
- For a new use case, track weekly ticket rate from go-live.
- Metric: number of days/weeks until the new use case’s ticket rate returns to at or below the baseline.
- Why it matters: A shorter time-to-baseline protects trust and frees CoE capacity instead of creating long-term support drag.
CoE operating health metrics: Can the CoE keep up?

- Governance Compliance Score (%) – Foundational
- Question: Are key governance cadences happening as designed?
- Formula:
Governance activities completed ÷ Governance activities planned × 100
(e.g., CoE councils, steering, release notes, intake triage).
- Why it matters: Inconsistent governance leads to unpredictable releases, weak comms, and confused users. That erodes satisfaction and UX Page Adoption over time.
- Data: Calendars, minutes, intake/release records (or an Anaplan governance module).
- Backlog Size & Throughput (% closed) – Performance
- Question: Is work flowing, or just piling up?
- Formula:
% Closed = Tickets closed in period ÷ Tickets opened in period × 100
optionally paired with average cycle time to close.
- Why it matters: A stuck backlog means pain points stay unresolved, UX improvements are delayed, and users lose patience.
- Data: Jira / ServiceNow / Azure DevOps, etc.
- CoE Self-Sufficiency Index (%) – Strategic
- Question: How dependent is the CoE on partners to evolve the platform?
- Formula:
Work delivered by internal CoE ÷ Total work delivered × 100
where “work” = enhancements, releases, backlog items, etc.
- Why it matters: At strategic maturity, higher self-sufficiency usually means faster iteration, more responsive enablement, and a better fit with business needs. At foundational stage, a lower index is acceptable; you expect it to grow as the CoE matures.
- Data: Backlog/release logs with a “delivery owner” field.
Business value and ROI: Making the case with evidence

Value metrics often fail not because value is missing, but because the method is fuzzy or keeps changing. To build credibility, anchor value on stable, auditable definitions.
- Cycle Time Reduction (days) – Foundational
- Question: Are planning cycles actually faster than before?
- Approach:
- Define clear, fixed “cycle start” and “cycle end” events.
- Track timestamps for each cycle (e.g., Forecast Apr-2026).
- Compare pre-Anaplan vs post-Anaplan or year-on-year.
- Why it matters: This is a timestamp problem, not an estimation problem. Shorter cycles directly reduce coordination loops, rework, and effort per cycle.
- Implementation: Keep a simple “Cycle Log” in Anaplan as the system of record, with gating so cycles can’t close without log updates.
- Forecast Accuracy Improvement (p.p.) – Performance/Strategic
- Question: Are forecasts objectively more accurate over time?
- Requirements:
- A frozen forecast snapshot (e.g., via Anaplan snapshot/freeze).
- A stable horizon definition (M+1, quarter-end, etc.).
- A fixed accuracy formula and actuals source.
- Why it matters: Better accuracy reduces avoidable cost (expediting, stockouts, last-minute changes) and improves decision confidence. The main risk is comparing moving targets or changing the horizon silently; treat major method changes as a re-baseline, not “improvement.”
A Practical ROI Formula for Anaplan
Define Anaplan ROI as:
ROI = (Total Benefits − Total Costs) ÷ Total Costs
Costs (annualized and scoped to the planning footprint):
- Subscription / license and vendor fees
- Implementation / change / expansion costs
- Run / operate costs (CoE FTEs, support, partner retainers, integration ops, etc.)
For benefits, start with two streams that are relatively easy to measure and audit. You can extend later to revenue and risk benefits.
- € Benefit (Hours Saved)
Hours saved per cycle × #Cycles per Year × Fully Loaded Hourly Cost × Realization Factor
- Fully loaded hourly cost: standard rate from Finance/HR.
- Realization Factor: conservative % (e.g., 30–70%) to reflect that not all saved time immediately converts to cash.
- € Benefit (Forecast Accuracy)
Baseline Value-at-Risk × (Accuracy Improvement in p.p. ÷ 100)
- Value-at-Risk here is not total cost or total margin. It’s the portion of financial performance exposed to avoidable inefficiencies from forecast error and credibly influenced by better planning (e.g., inventory, variable costs linked to pricing, marketing; sometimes logistics/penalties).
Then:
Total Benefits (€) = Benefit (Hours Saved) + Benefit (Forecast Accuracy)
ROI = (Total Benefits − Total Costs) ÷ Total Costs
With this in place, you can show a clear line from CoE metrics → process improvements → financial outcomes.
In addition to quantitative metrics it makes sense to combine them with a qualitative CoE maturity Self assessment by collecting a Survey results for CoE members.
Here is an example of such a survey:

A wholistic view on both types of metrics brings us to a CoE Maturity Score.

Final thoughts
With a structured metrics system, even a busy CoE can avoid getting “stuck” and keep moving toward strategic impact. The four lenses show what to measure; the maturity view shows how to read those signals over time; the ROI method connects it all back to value.
If you’re building or maturing your CoE, use Community resources, adapt them to your context, and keep your metrics practical and decision-oriented. Speaking as a Certified Master Anaplanner, that’s where I see CoEs sustain momentum and turn Anaplan into a core planning capability rather than just another tool.

