Author: Kevin Beltz is a Certified Master Anaplanner and Principal Platform Adoption Specialist at Anaplan.
Budget vs. Actuals. Last Year vs. This Year. What-if Scenario A vs. What-if Scenario B.
As an Anaplan model builder, solution architect, or end-user, you know that comparing versions is a foundation of insightful analysis to confirm and validate plans. Are you using the best method?
The way you structure your version comparisons impact your model's scalability, performance, and the user's ability to make decisions. Choosing the wrong path can lead to cumbersome rebuilds and slow reports, while the right one empowers users with flexible, on-the-fly insights.
In this post, we'll break down three distinct methods for handling version comparison in Anaplan. There are more options than the three I’m discussing, and each situation and model has different nuances and requirements.
Setting the stage
I adapted the Level 1 FP&A model where there is a basic P&L with revenue, expenses, and profit (17 line items or rows), versions, Country, and Month. I replaced the native Anaplan Versions with a custom “Version List”. Additionally, I added in more calculations like YoY % Growth for a few line items into my source module for these reports, the REP03 Profit & Loss Report. I now have 22 line items for my end-user to view. Lastly, I added data to the Actuals and Budget versions. One comment, in a “real-world” P&L use case, I would have liked to see this data structure similar to Hanwen’s article (actual data with no versions + snapshotted versions) and Austin’s “How I built It” article (mapping the hierarchy to a LiSS & utilizing a SUM function, & not COLLECT).
I modeled three different options to do the same version analysis, and I will go through how I built them and talk about the pros and cons of each one. There are two important articles I will reference, The Power of the ‘No’ Version Approach in Anaplan and Variance Analysis with Native Versions Made Easy.
Example 1: Line item subsets and multiple modules
Core idea: Use Line Item Subsets and the User Dimension to pivot P&L line items into a dimension, allowing for dynamic variance calculations in a reporting module. It is the most similar to the OEG Best Practice article, Variance Analysis with Native Versions Made Easy.
Module 1: USER01 User Filter
- Dimensions: Users
- Line Items: Version 1, Version 2

Module 2: CALC01 P&L LiSS Collect

Module 3: REP04 – P&L Report – Real Versions x Users
- Dimensions: G2 Country, Users (Active Subset), P&L Values (Line Item Subset)
- Line Items: Version 1, Version 2, Variance, Variance %

Pros:
- It is fast to implement the backend.
- It is considered an Anaplan best practice.
- It allows for an unlimited number of versions to be compared (limited only by the number of versions in the model).
- New P&L line items are easy to add due to the dimensional nature of the setup.
Cons:
- Calculated % line items in the LiSS (YoY, Margin%) do not calculate naturally do to the LOOKUP, requiring DCA to remove read access (I did not model this).
- There are limitations on number formatting and custom sorting for the line items. Can use the format styles in the UX but will have to choose between % and BPS (can’t do both).
- The reporting module can have poor performance and large size implications if not managed carefully.
- The user needs a clear mechanism to track which versions are selected for "Version 1" and "Version 2".
UX:


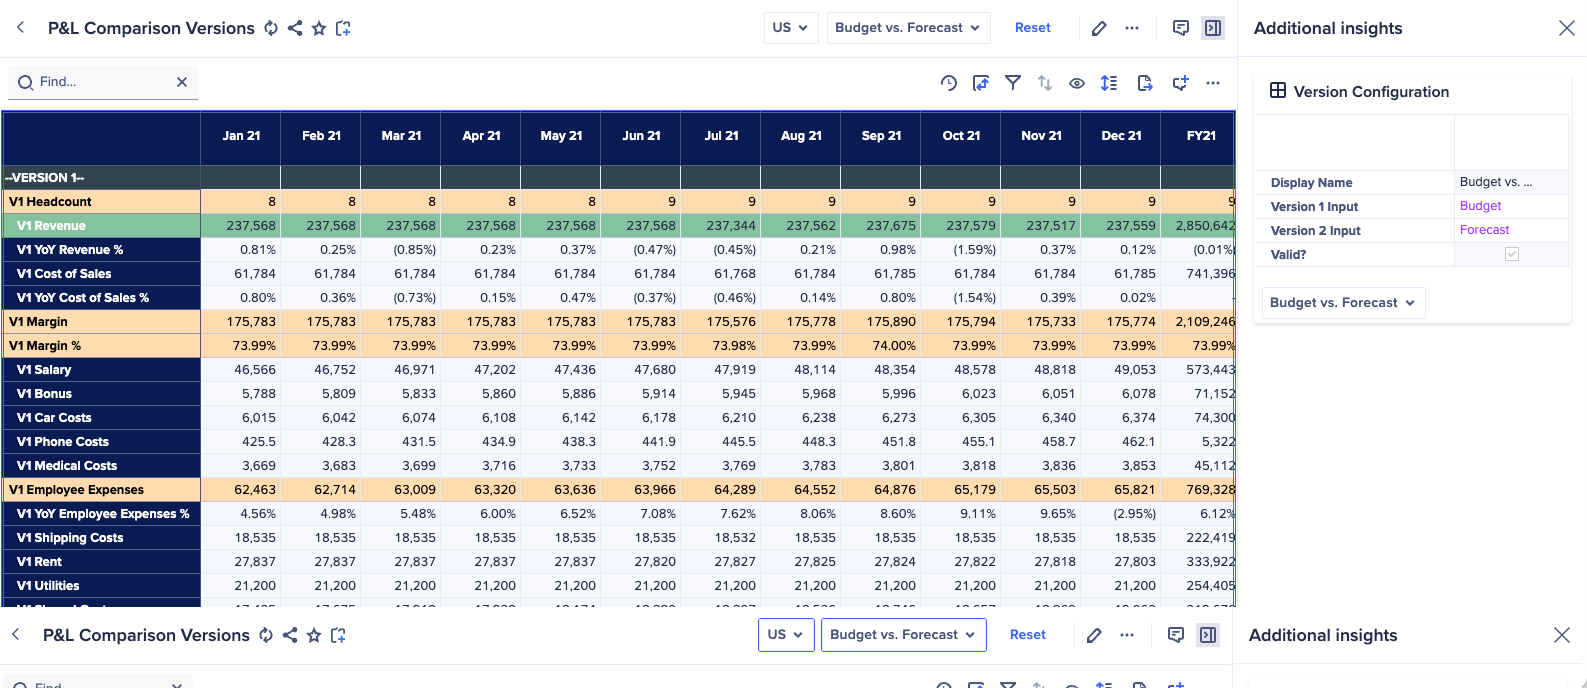
Example 2: Comparison list for dynamic version comparison
Core idea: Utilize a new, numbered list, named "Comparison," to create dynamic version comparisons for all users. A model administrator or super user would oversee setting the version comparisons for all users.
Module 1: SYS Comparisons
- Dimensions: Comparisons
- Line Items: Display Name, Version 1 Input, Version 2 Input.
- Display name's formula is a text concatenation of the name(Version 1) & “ vs. “ & name(Version 2)

Module 2: REP05 P&L – Comparisons
- Dimensions: Comparisons, G2 Country, and Month
- Line Items: I have 22 (original line items in REP03) x 4.
- Example: for Revenue, I have: V1 Revenue, V2 Revenue, Revenue Variance, and Revenue Variance %.
- The concept from here is simple, you have a module with all line items dynamically comparing any sort of set of versions that you would want, limited by the number of versions in your comparison version list.
- This type of comparison report is usually not recommended.

Pros:
- You have absolute control over number formatting and summary methods - Such as basis point formats. There is no reliance on the UX Format.
- Great flexibility on the order of which line items appear.
- Can perhaps save space by not having all the dimensionality for every line item, for example you may not need every single variance percent for every P&L line item.
Cons:
- Version 1, Version 2, etc in the line items names.
- Manually add new line Items — not scalable.
- Slower to implement, CoModeler made this quite easy though.
- Relational instead of multidimensional.
- Makes data dense (con for Polaris).
Discussion:
It would be easy to add the user dimension in these modules by adding the user list to the Comparisons module and P&L report. I don’t think it is necessary because you can add in more comparison list members easily.
UX:
Is a vertical scroll. Another good option would be to have the variance and variance % sections in the insights panel as individual cards to open and close.

Example 3: Version list to native versions with line items
Core idea: Map the Version List to Anaplan List & use built in variance calculations that are available in the Native Version List. This is directly against the Planual Rule 1.02-02, however, since it's only used for select reporting modules, I think it is ok in this select circumstance. Additionally, one could build this without the user dimension fairly easily.
Module 1: USER02 Native Versions | Dimensions: Native Versions, Users: Active | Line Items: Version Mapping


Module 2: REP04 Profit & Loss Report – Real Versions x Use
- Dimensions: Native Versions, Users: Active, G2 Country, Months
- Line items: For the data line items, I'm doing a simple formula that has the respective one item with a LOOKUP to USER02 Version Mapping.Version Mapping. For any other line items that I need to calculate such as the YoY, I am calculating that within the module so I can take advantage of the formula summary.

Pros:
- Fast to implement.
- Dynamic for users to change version comparisons.
- Good control of line item formatting coupled with UX Format Configuration.
- Formula summary methods.
- No nested IFS.
Cons:
- Creating a Variance version goes directly against Planual Rule 1.02-02.
- In modules with three or more dimensions, if you have calculation line items and aggregations, the results may not always give the expected result due to different calculation priorities. Finally, you can't amend the summary method for a version formula within the versions setting.
- New P&L lines (line items) need to be added manually, reducing scalability.
UX:

When to use each method
Choosing the right version comparison method depends on your specific reporting requirements, model design philosophy, and development timeline. Here’s a guide to help you decide:
Use Example 1: Line Item Subsets if...
- Your P&L or report structure is expected to change often, requiring the easy addition of new line items.
- Rapid development and adherence to Anaplan best practices are top priorities.
- You don’t have percentage line items / don’t want to model the workarounds.
- You are prepared to manage the potential performance and size implications of the reporting module carefully (user list).
- You need the flexibility to compare an unlimited number of versions.
Use Example 2: Comparison List if...
- You need to optimize model space and performance by being selective about which line items require full dimensionality.
- You require a high degree of control over number formatting (e.g., basis points, percents) and summary methods.
- The order of line items is critical for the report's usability.
- You have a fixed and limited number of version comparisons to analyze.
Use Example 3: Native Versions if...
- You want the fastest and most straightforward implementation for users to perform ad-hoc version comparisons.
- You want to leverage Anaplan's built-in variance calculation engine for simplicity.
- You are looking for a good balance between implementation speed and control over line item formatting.
- You are prepared to manage the potential performance and size implications of the reporting module carefully (user list) – please note, you could build this w/o the user dimension and have a less flexible report.
- You understand and accept the trade-off of going against Planual Rule 1.02-02 for the benefit of dynamic user-driven analysis.
Feature | Example 1: Line Item Subsets | Example 2: Comparison List | Example 3: Native Versions |
|---|
% and bps Line Items | Not Capable | Capable | Capable |
Implementation Speed | Fast | Medium | Medium |
Modeling Scalability (New Versions) | High | High | High |
Modeling Scalability (New P&L Items) | High | Medium | Medium |
Formatting Control | Medium | High | Medium |
Calculation Flexibility | Medium | High | Low |
Performance | Medium | Medium | Medium |
Adherence to Best Practices | High | Medium | Low (violates a Planual rule) |
User Experience | Medium | Medium | Medium |
Questions? Leave a comment!