Author: Calvin Magondo is the Product Manager, Enterprise Experience at Anaplan.
Combined Grids and multi-module reporting
We are excited to announce the much anticipated enhancement to the Anaplan User Experience (UX): Combined Grids. This powerful new feature and platform capability will address one of the most common challenges for planners and model builders today by allowing you to bring data from multiple modules into a single, unified grid. We’ve already seen customers finding real value in this enhancement from, streamlining UX by reducing unnecessary white space from multiple grids on page, to unlocking more intuitive planning experiences for end users and enabling more efficient model building whilst removing inefficient workarounds.
We developed Combined Grids based on direct feedback from our user community to solve a common challenge: viewing and interacting with related data from different sources in one place. Let's explore what it does and, more importantly, see how early access customers are already using it.
Combined Grids demo
The Challenge: building complex, multi-module views
As Anaplan models grow in sophistication, so do the demands on the UX. Page builders often need to present data from different modules side-by-side. For example, you might want to show product attributes next to monthly sales data, or compare a driver-based forecast with the final plan numbers. While this has always been possible using multiple grid cards, it presented a few common hurdles:
- Synchronizing data: Keeping separate grids aligned when scrolling or filtering required careful setup and could sometimes lead to a disconnected user experience.
- User-driven analysis: Applying a single sort or filter across multiple, separate grids wasn't possible, limiting a user's ability to analyze the data holistically.
- Model building workarounds: To create the ideal view, model builders often had to create "helper" modules or duplicate data, increasing model size and maintenance. This could also mean straying from best-practice modeling principles like DISCO.
- Exporting data: To analyze data from different grids together, users frequently had to export multiple files and combine them manually in an external tool.
Combined Grids was designed to address these challenges directly.
The solution: a single, unified grid with data from multiple modules
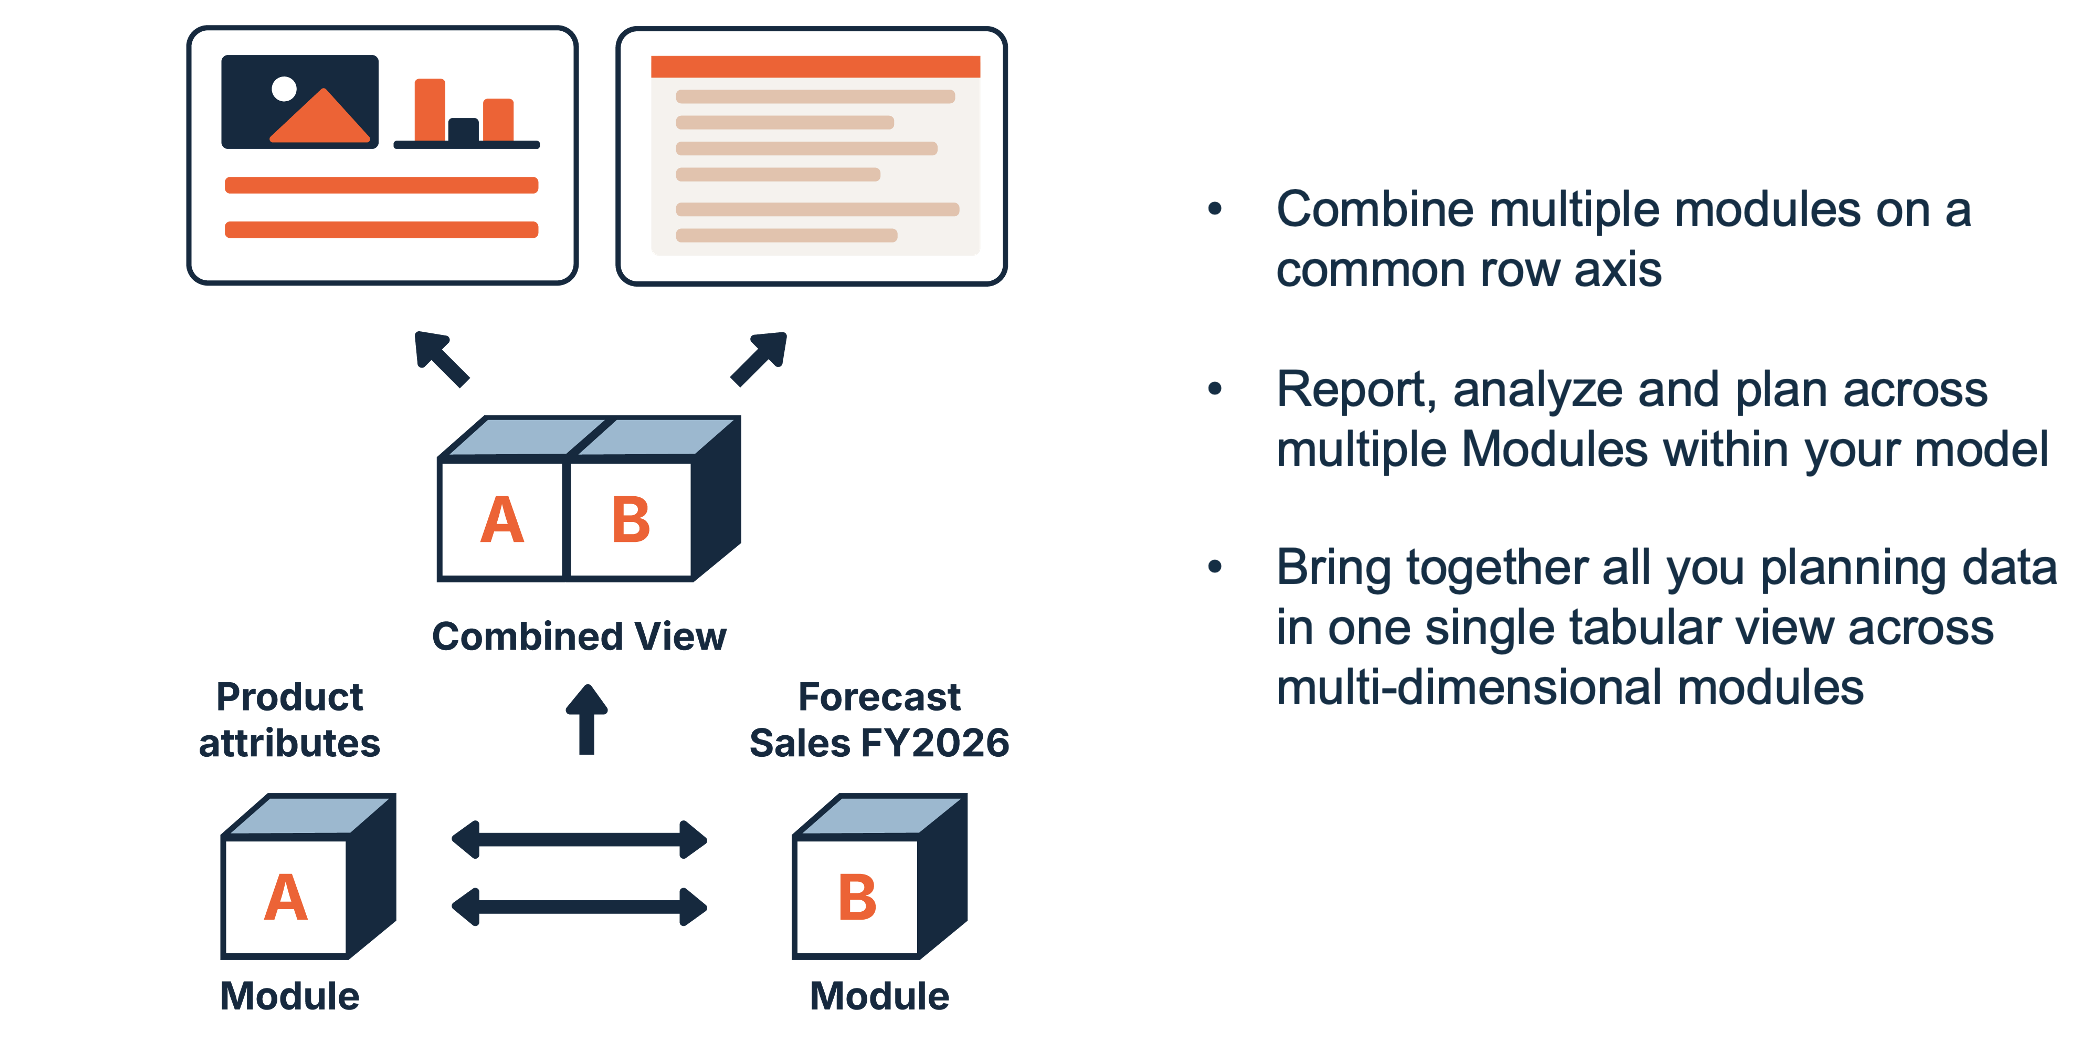
At its core, Combined Grids allows a page builder to merge up to five modules into a single grid on a UX page. The key requirement is that the modules share a common row axis. This enhancement unlocks several benefits:
- A unified view of data: All your data is presented in one grid, which saves screen space and provides a more intuitive user experience.
- Powerful end-user interaction: Users can apply a single sort or filter across all the data in the combined grid.
- Simpler model design: It reduces the need for those complex workarounds, allowing for cleaner, more efficient models that adhere more closely to best practices like DISCO. An early access customer said: "Combined grid allows us to avoid creating redundant line items... and more strictly adhere to DISCO and 'create once reference multiple times."
How customers are using Combined Grids
The best way to understand the feature's impact is to see how it's being used in real-world scenarios. Our early access customers have already found creative and powerful ways to put Combined Grids to work.
Streamlining budgeting and reporting at Jaguar Land Rover (JLR)
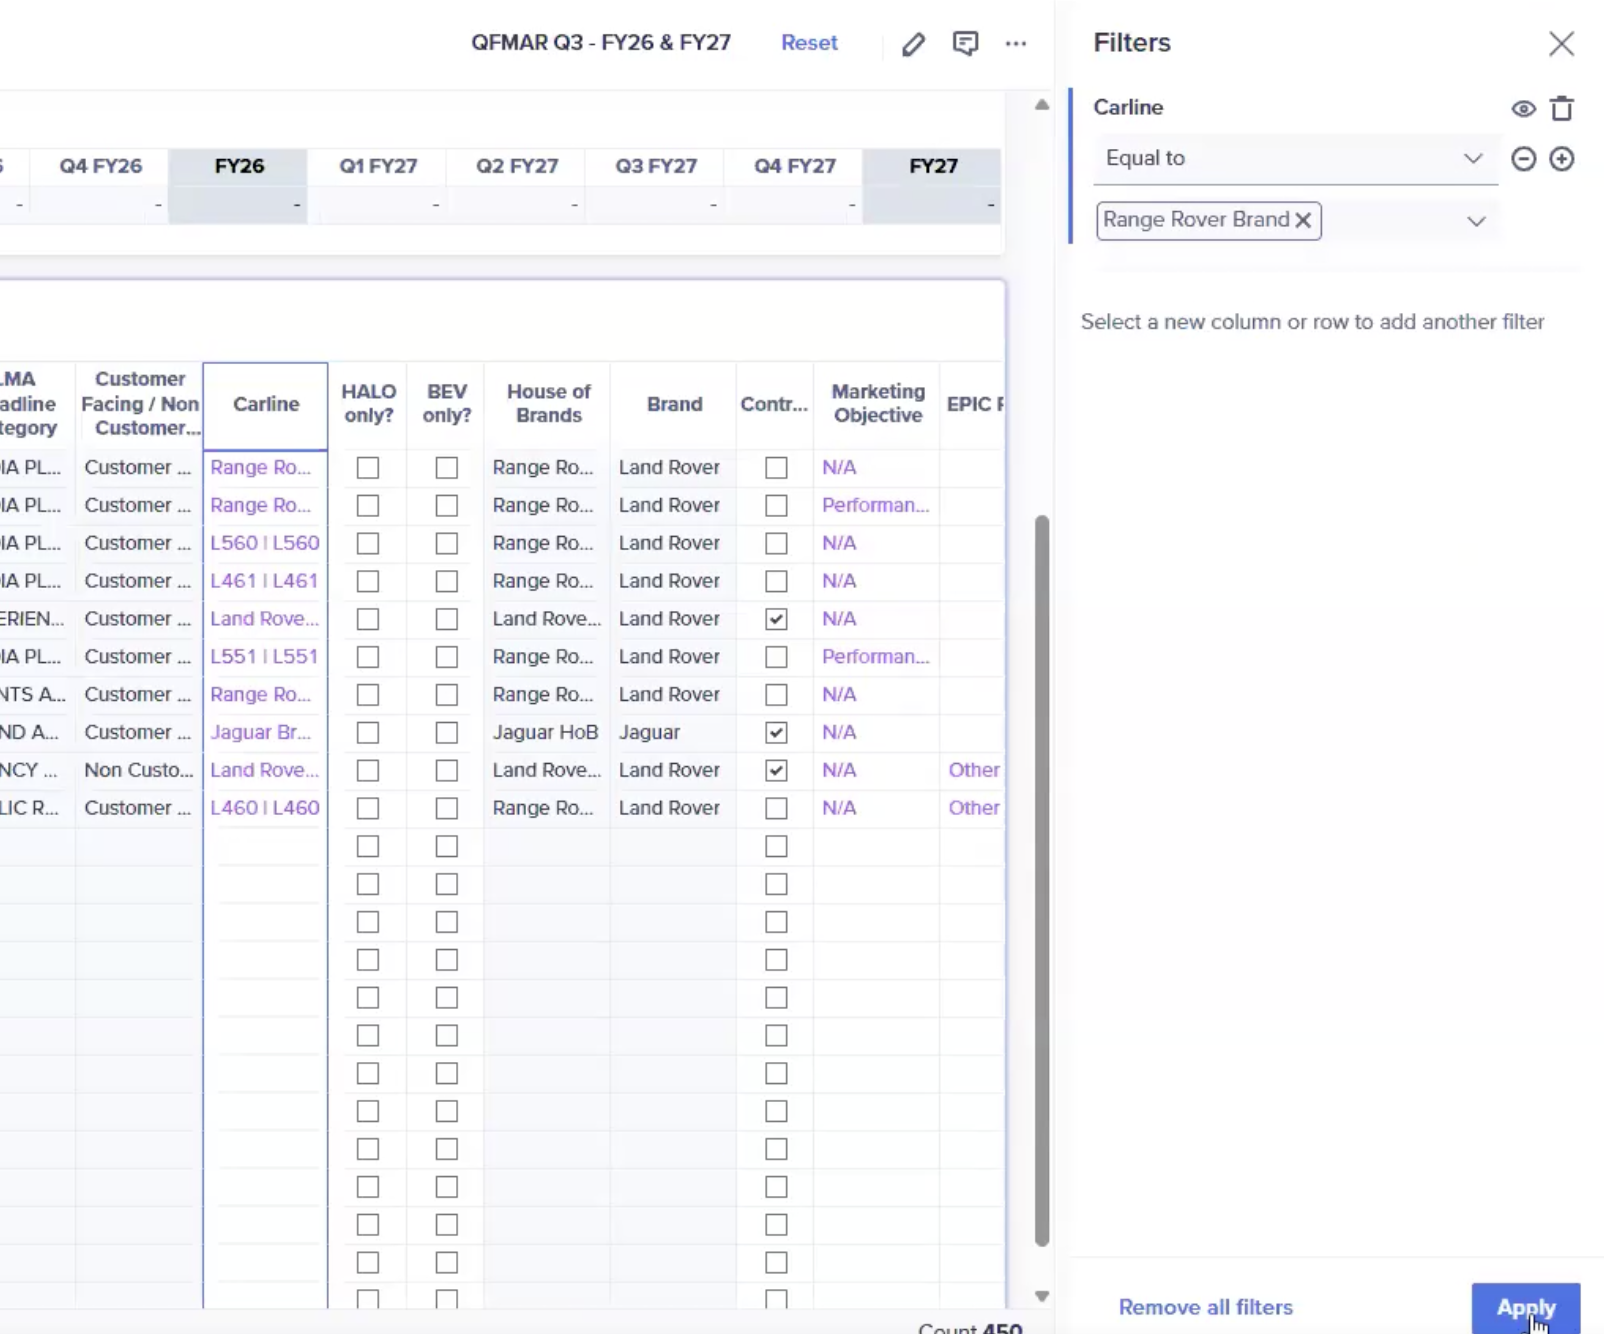
For their marketing budget, JLR needed to plan values across multiple time periods and for lines with many different attributes.
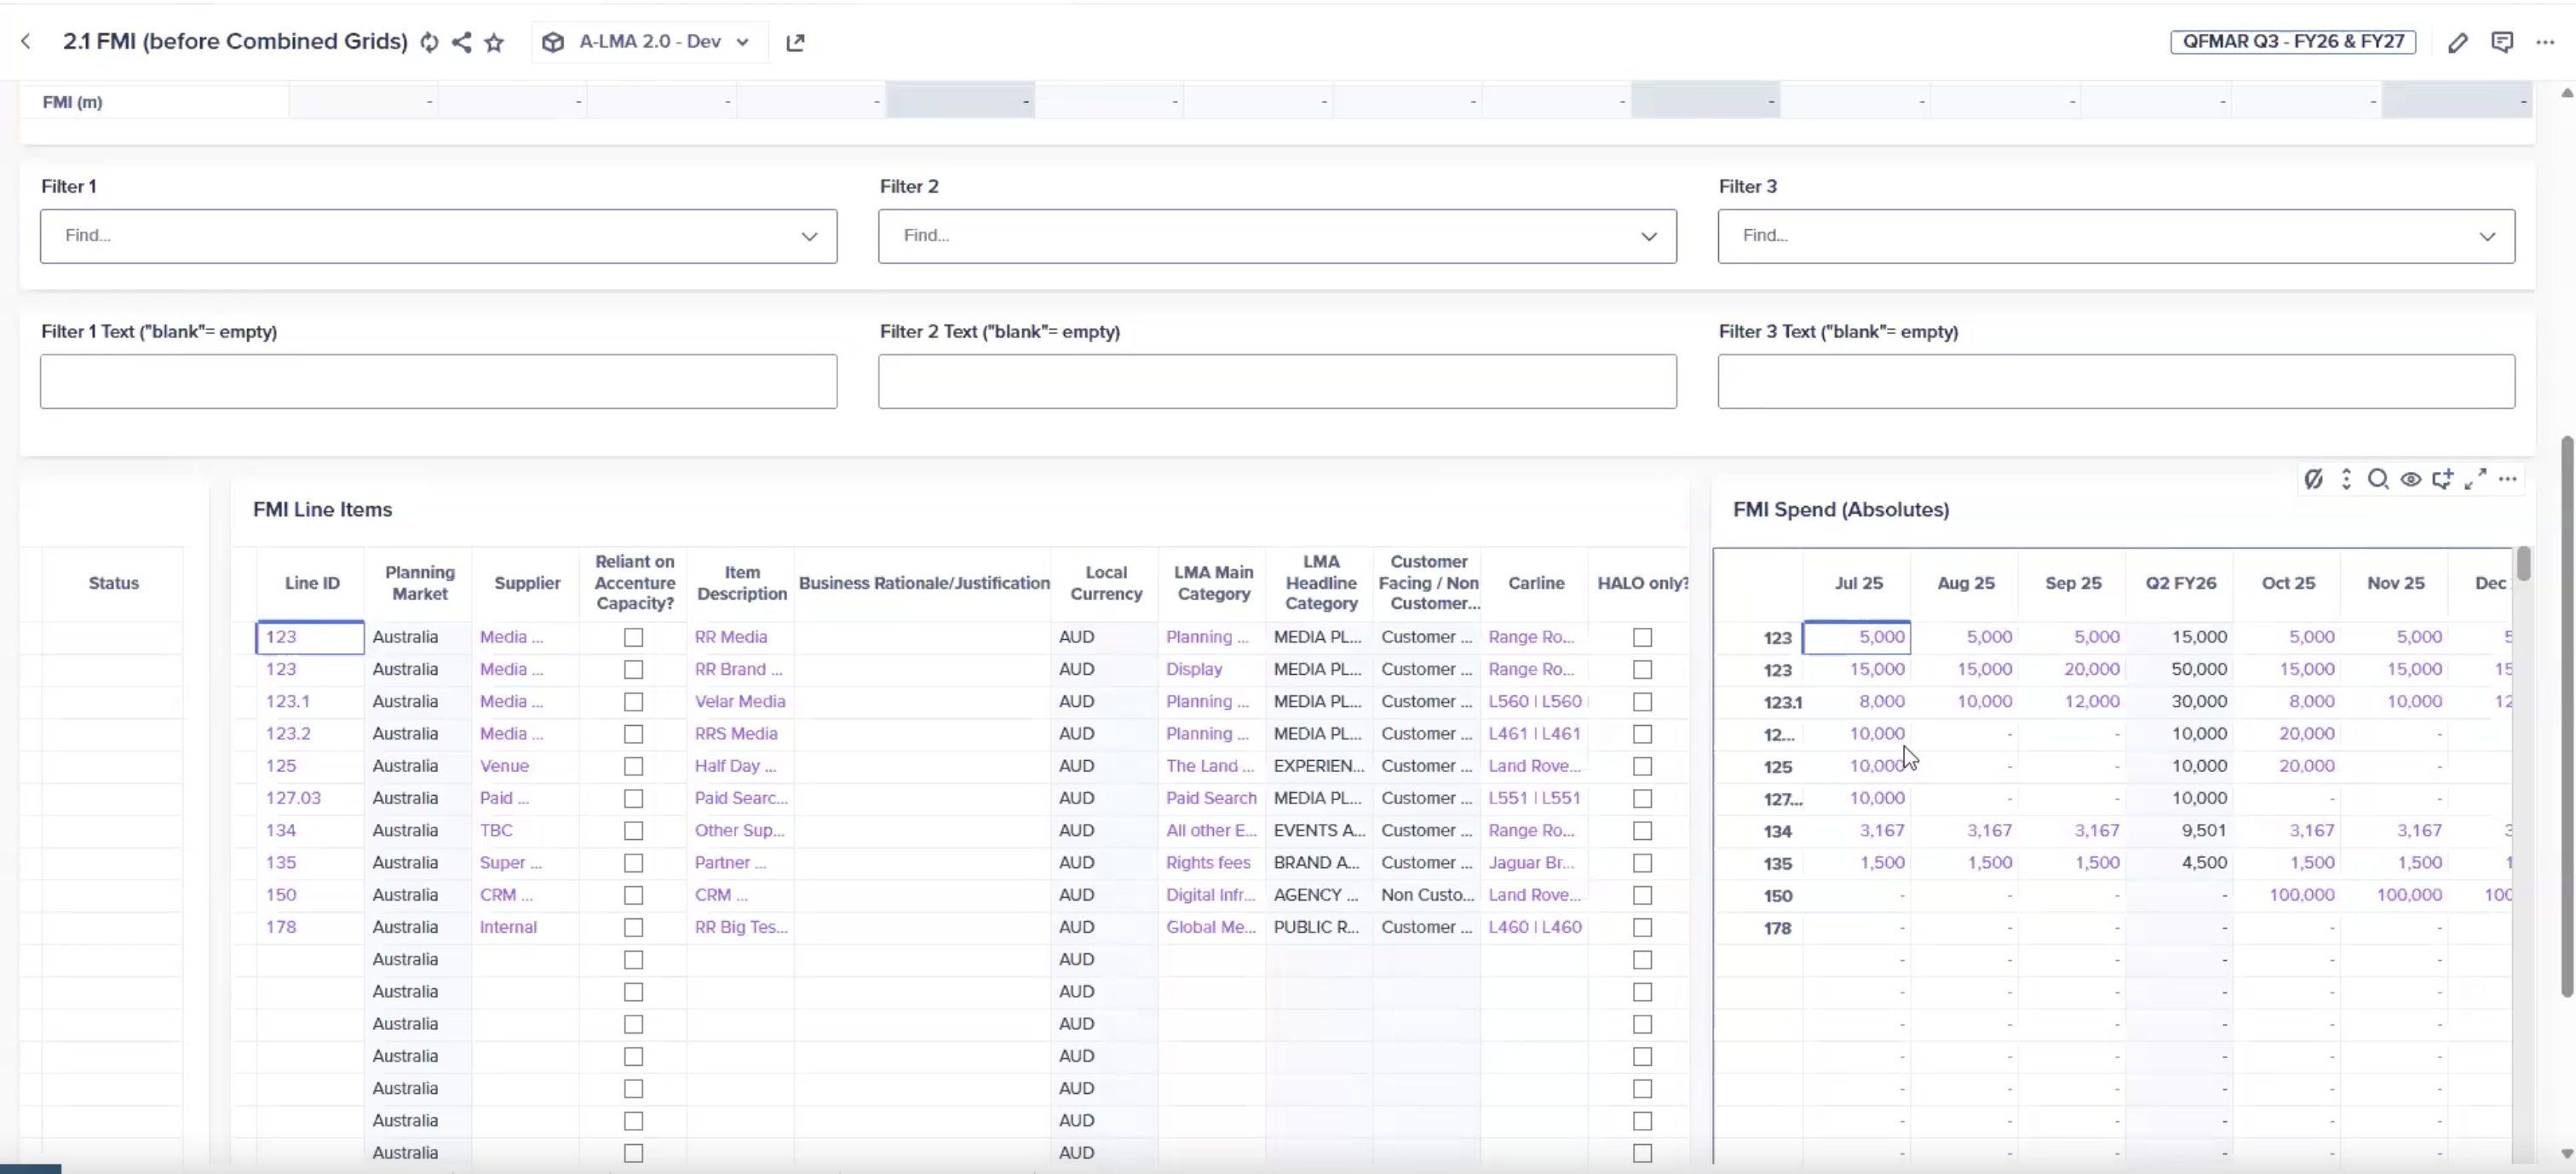
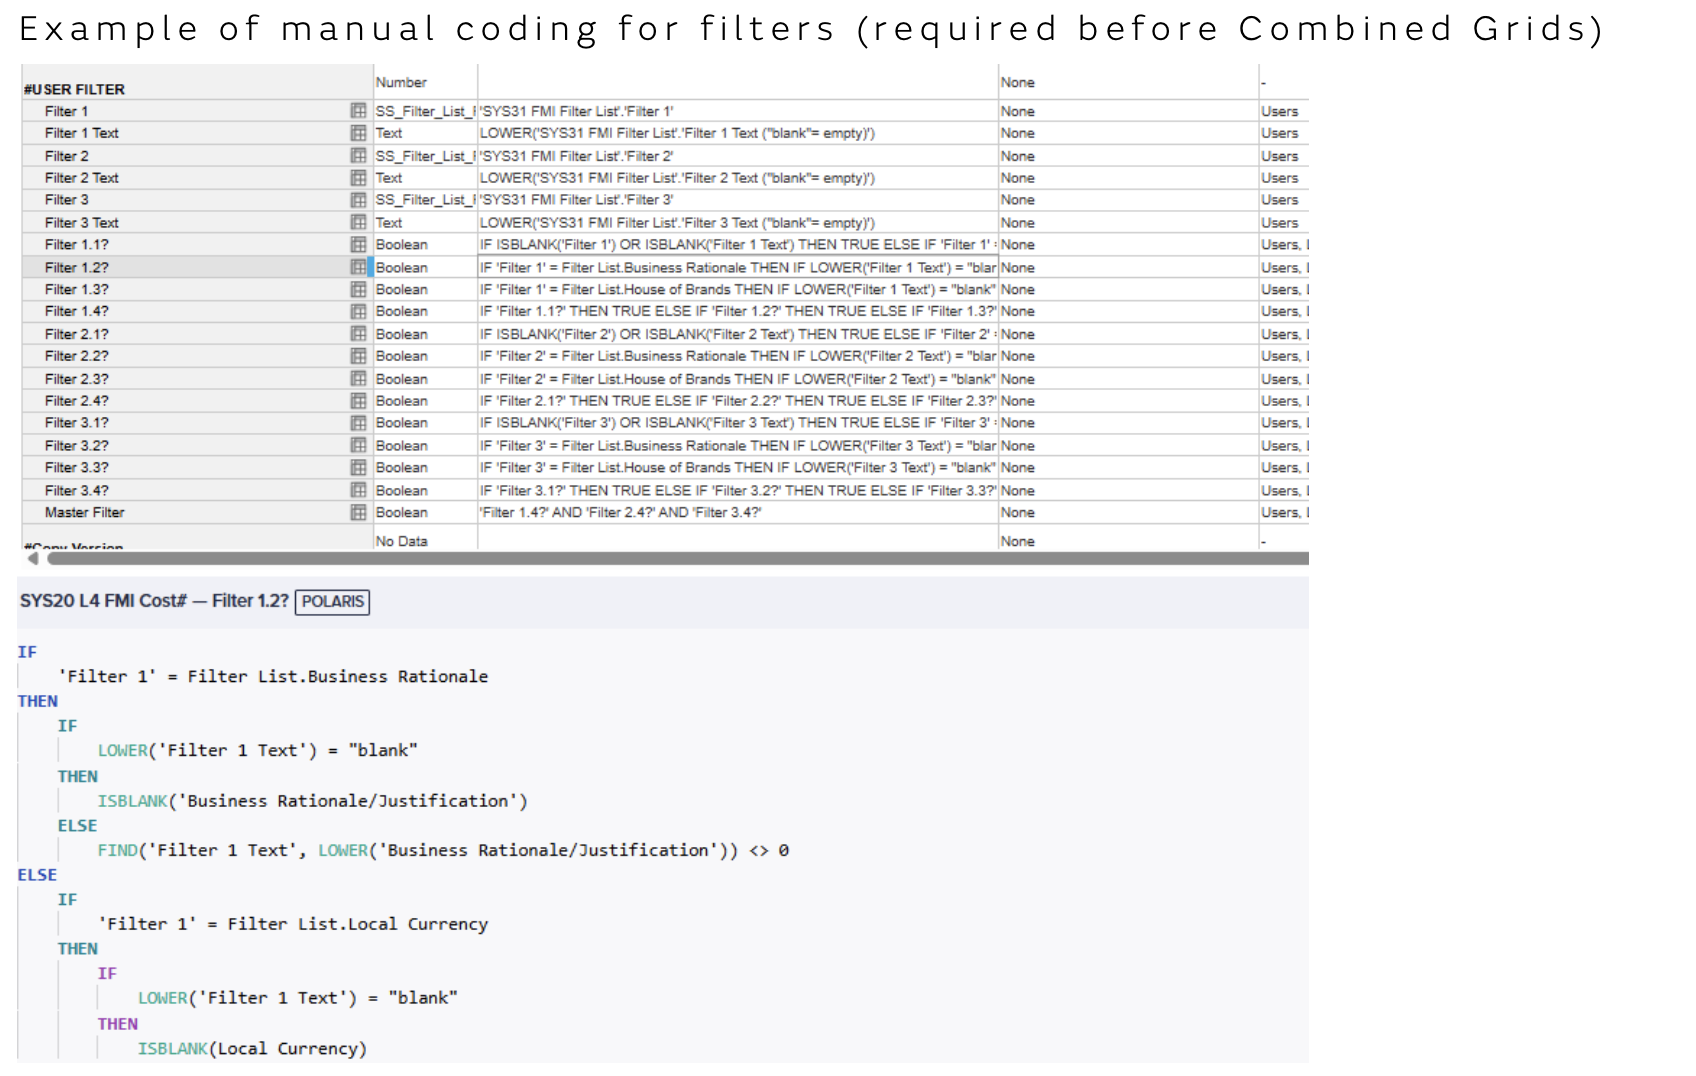
Before: This required two separate modules — one for the attributes and one for the budget values. On the UX page, users had to input data on two separate grids and perform two separate exports to get a complete picture. Filtering was complex and had to be pre-coded by their model builders.
UX page before Combined Grids:
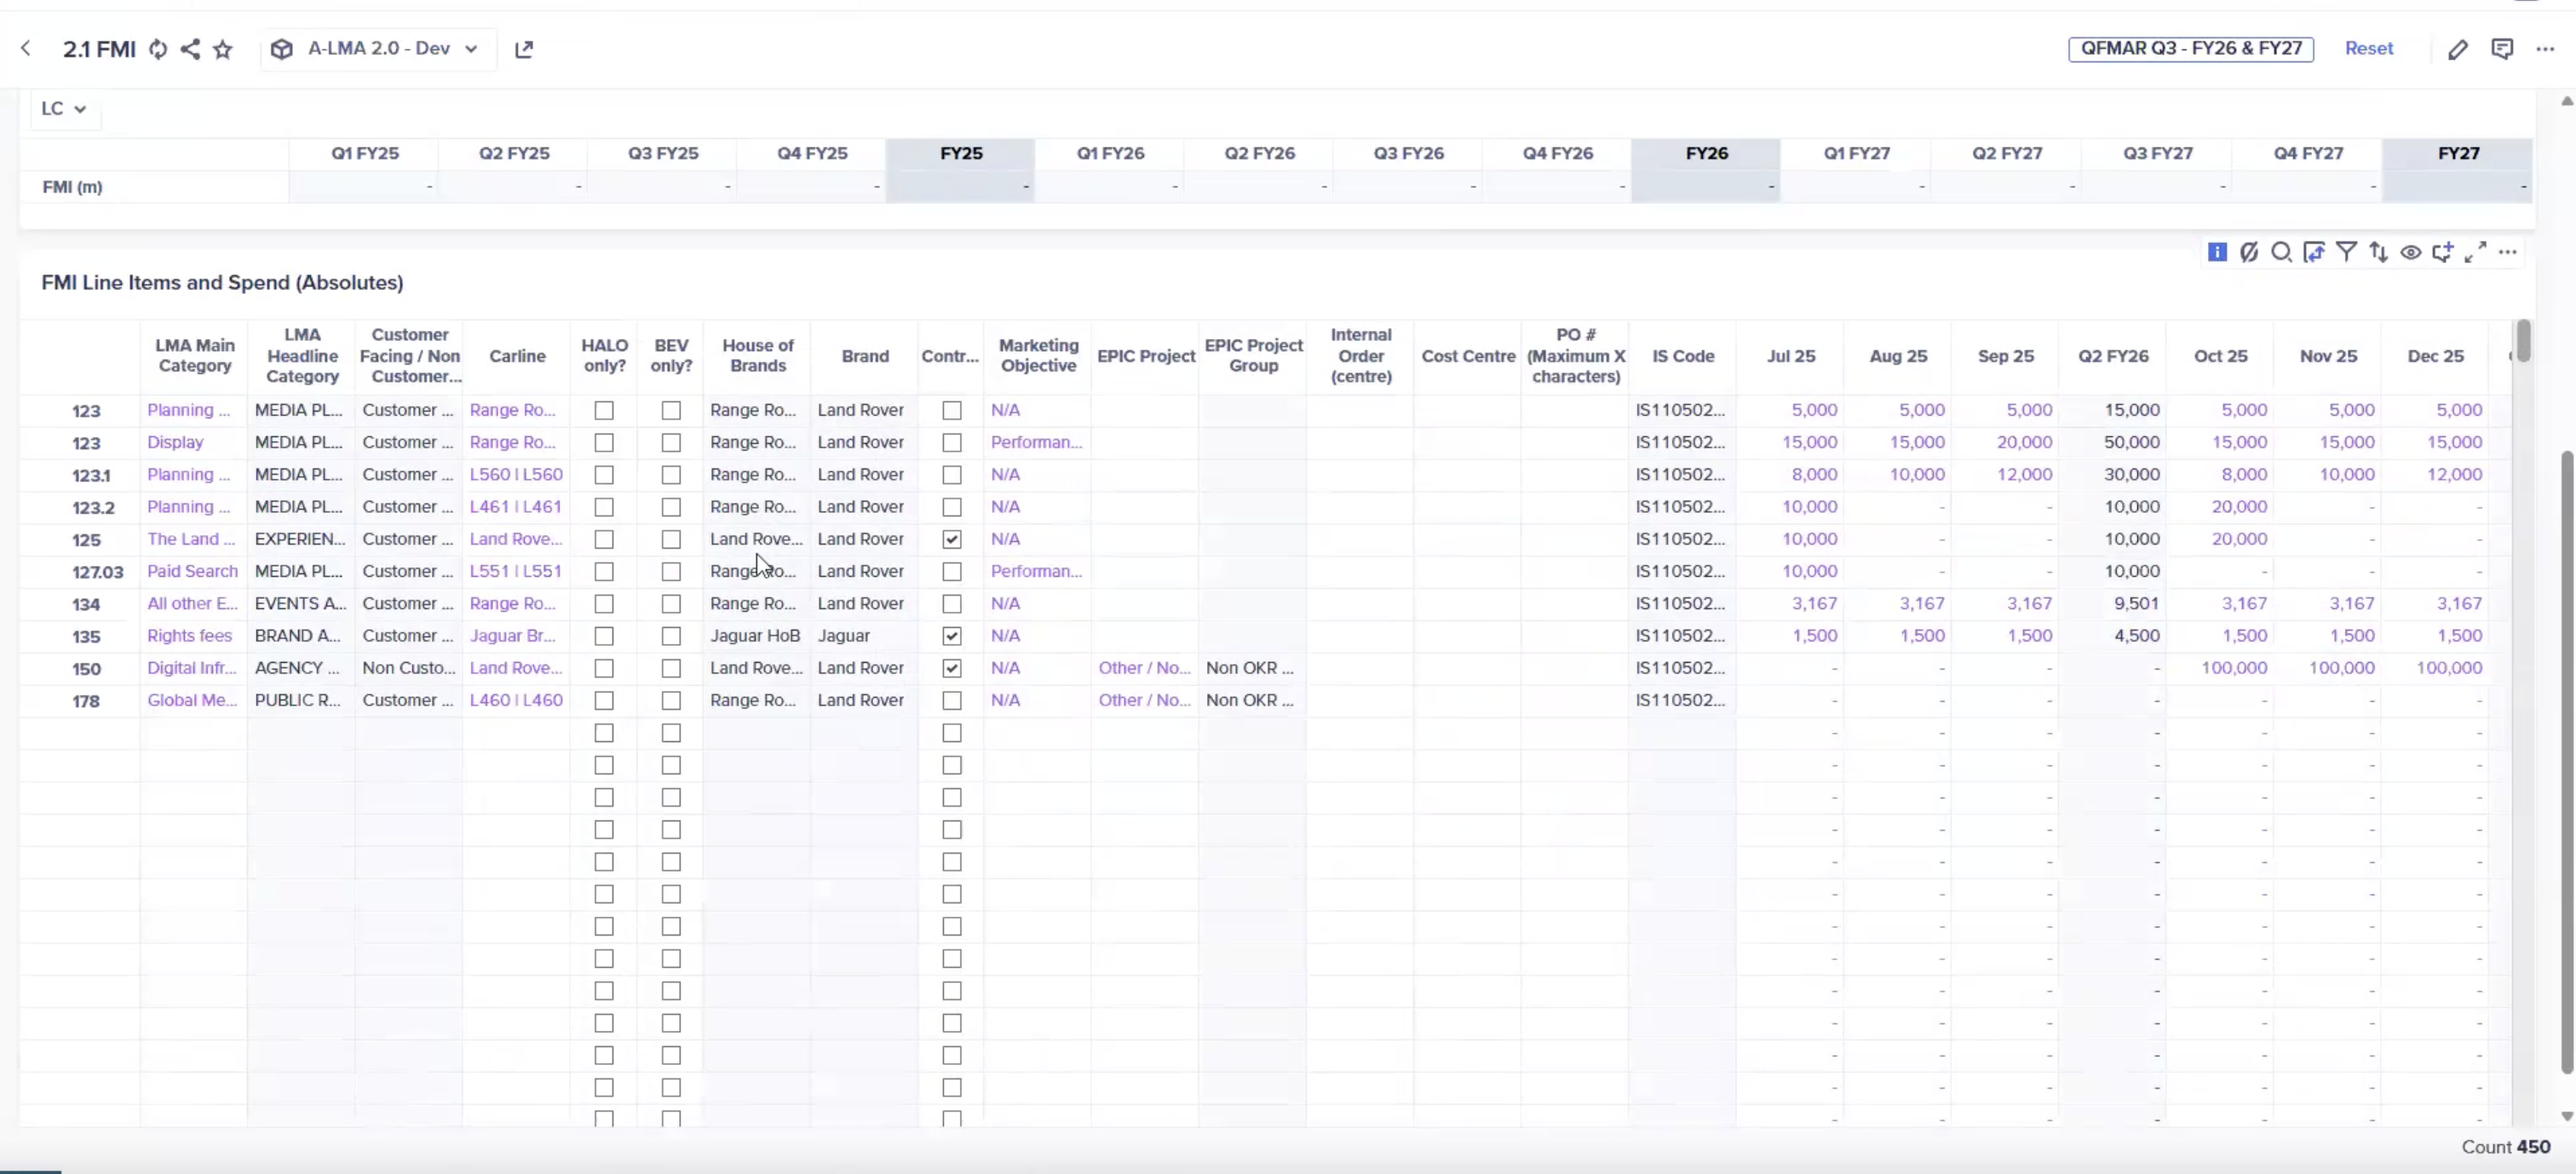
With Combined Grids: JLR now combine the attributes and budget modules into a single view. Users can input data on one grid and run a single export. Most importantly, users can now apply their own filters and sort by value, giving them far more flexibility for analysis with less upfront work for model builders.
UX page now with Combined Grids:
No back-end filters required, JLR now simply make use of Anaplan’s native filtering for end users.
Creating comprehensive forecasting views at Unilever
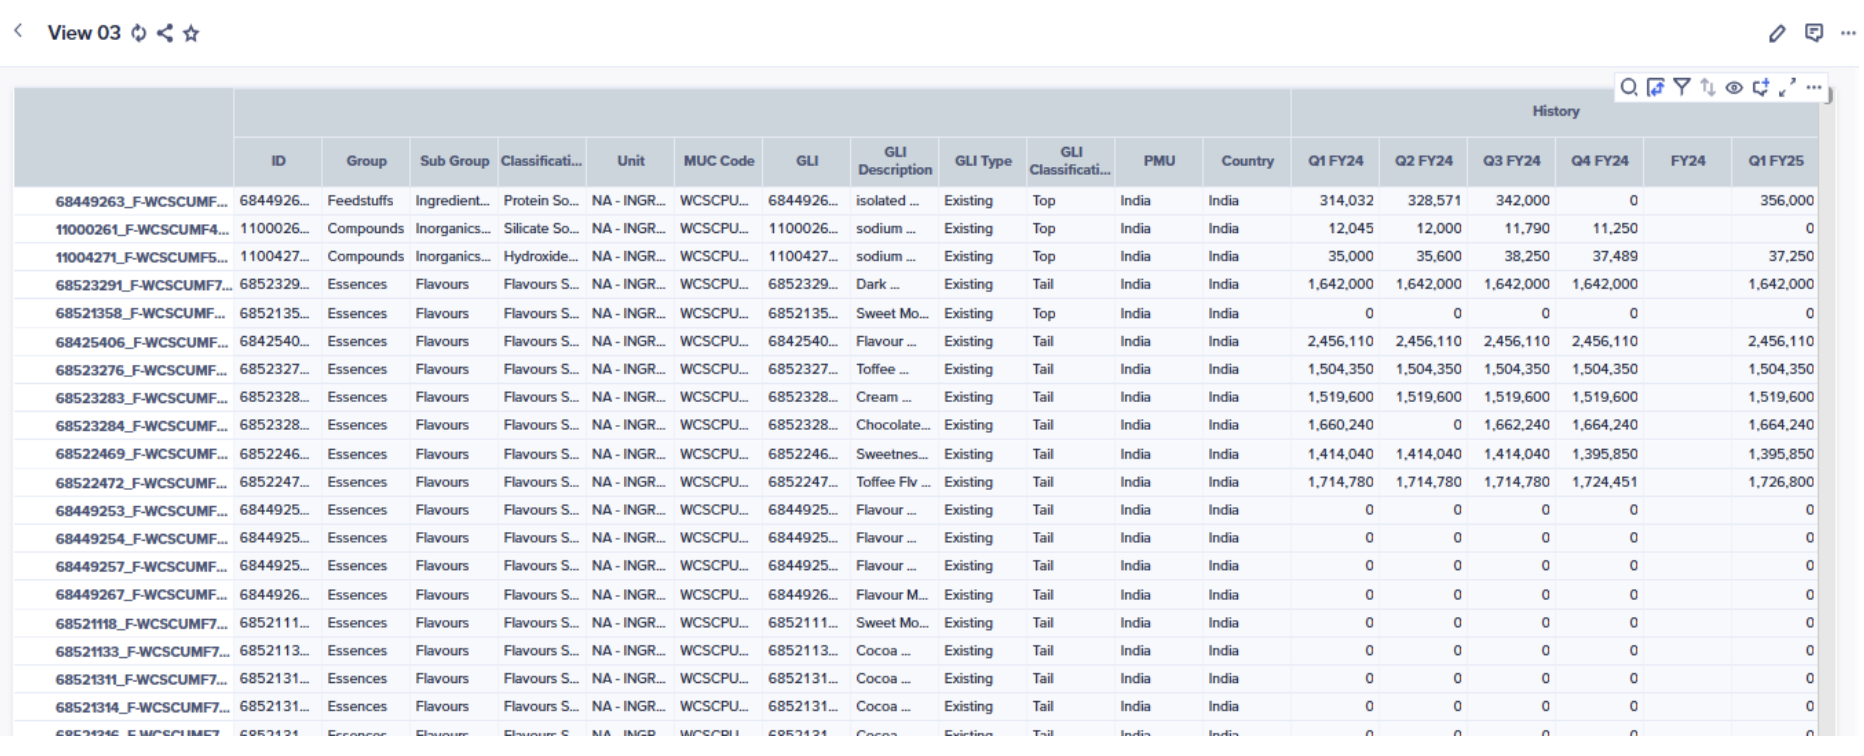
Unilever has a large-scale forecasting process with over 800 users globally. Their challenge was to display all material attributes (like Group, Subgroup, Classification) and reference numbers alongside the forecast data in a single view.
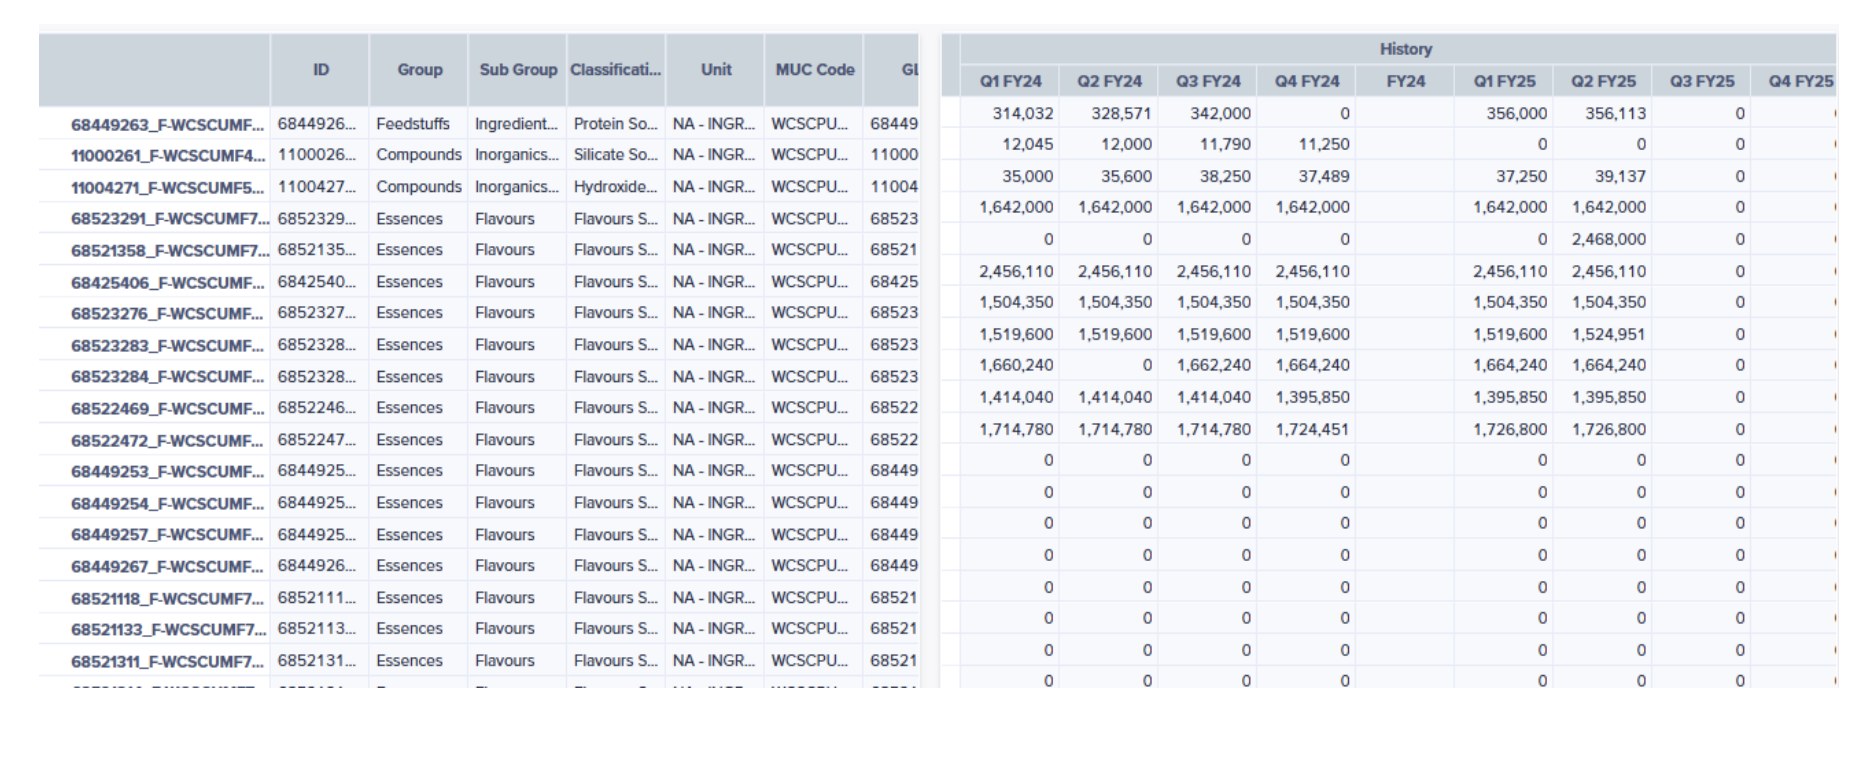
Before Combined Grids: This information was spread across multiple grids, making it difficult for users to see the full context at once.
With Combined Grids: Unilever now present all attributes and reference data together in a unified grid. This gives their forecasters a complete and contextual view, helping them make more informed decisions quicker.
Getting started with Combined Grids
Creating a combined grid is straightforward:
- Add a Grid to a page: Add or edit a grid card onto your UX page.
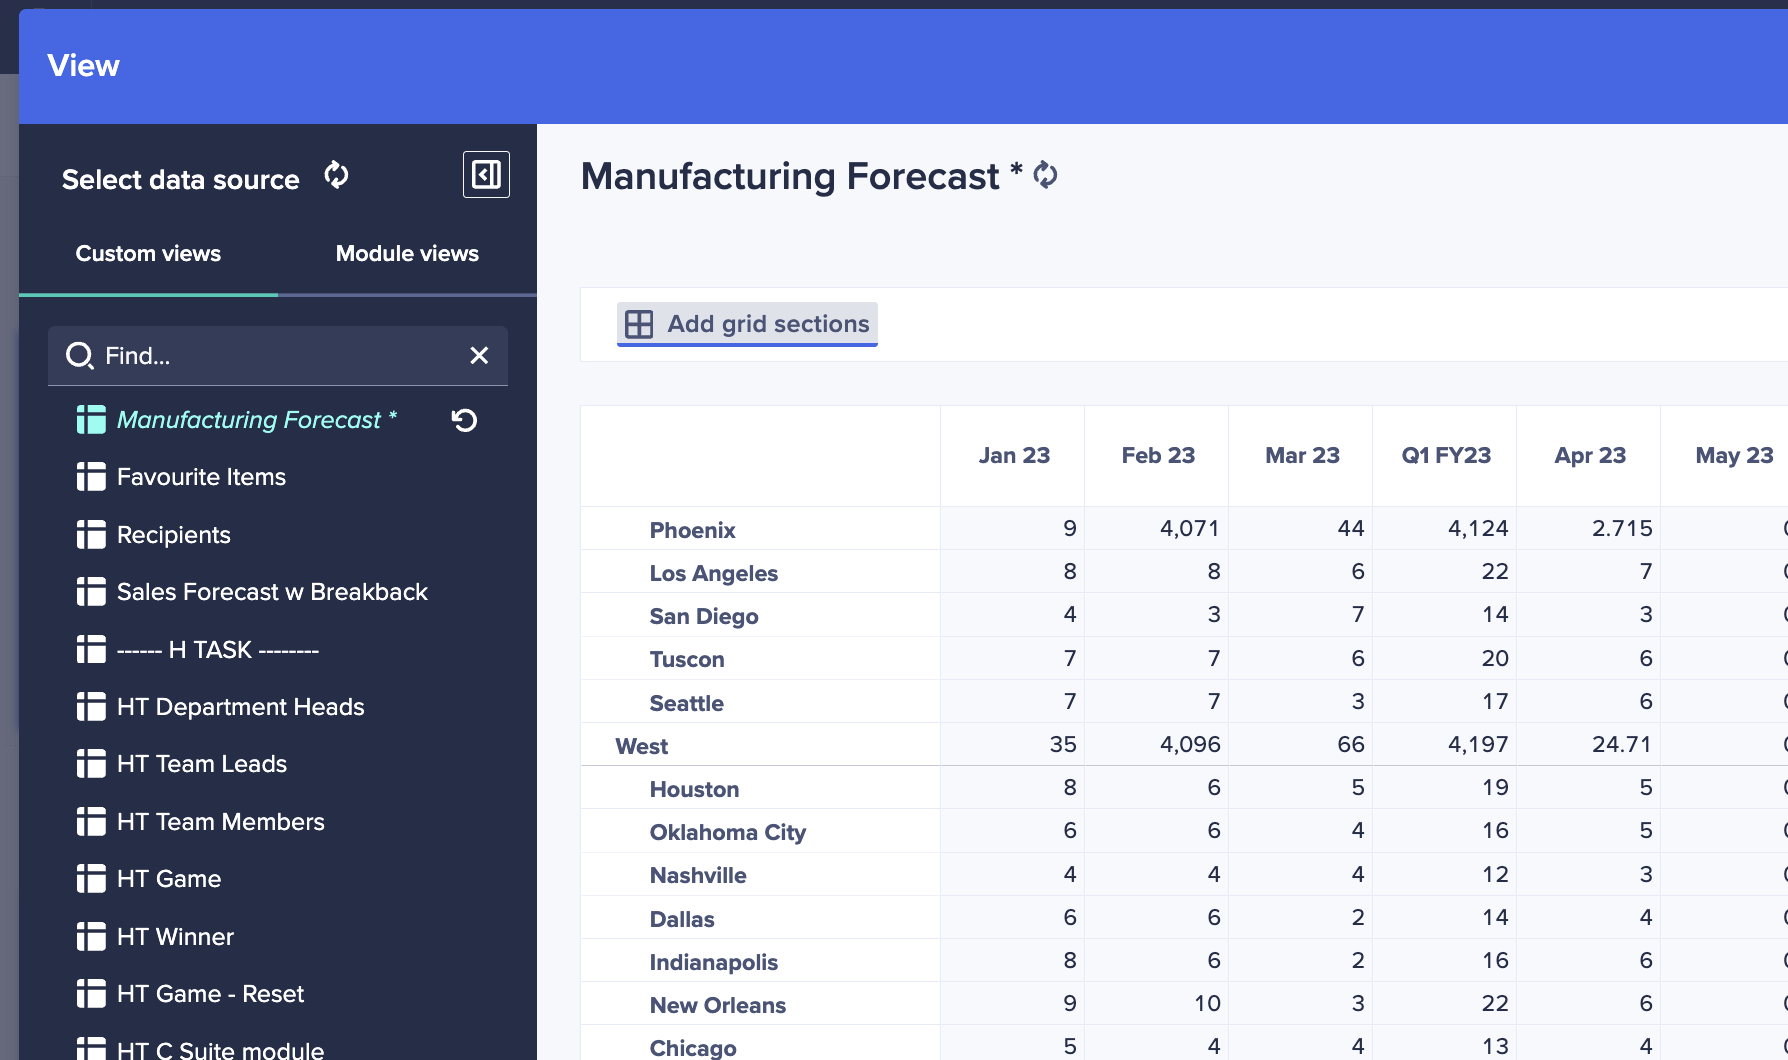
- Select primary module: Choose the grid you want to appear first on your combined grid. Note: The order of modules cannot be changed after creation, so plan accordingly.
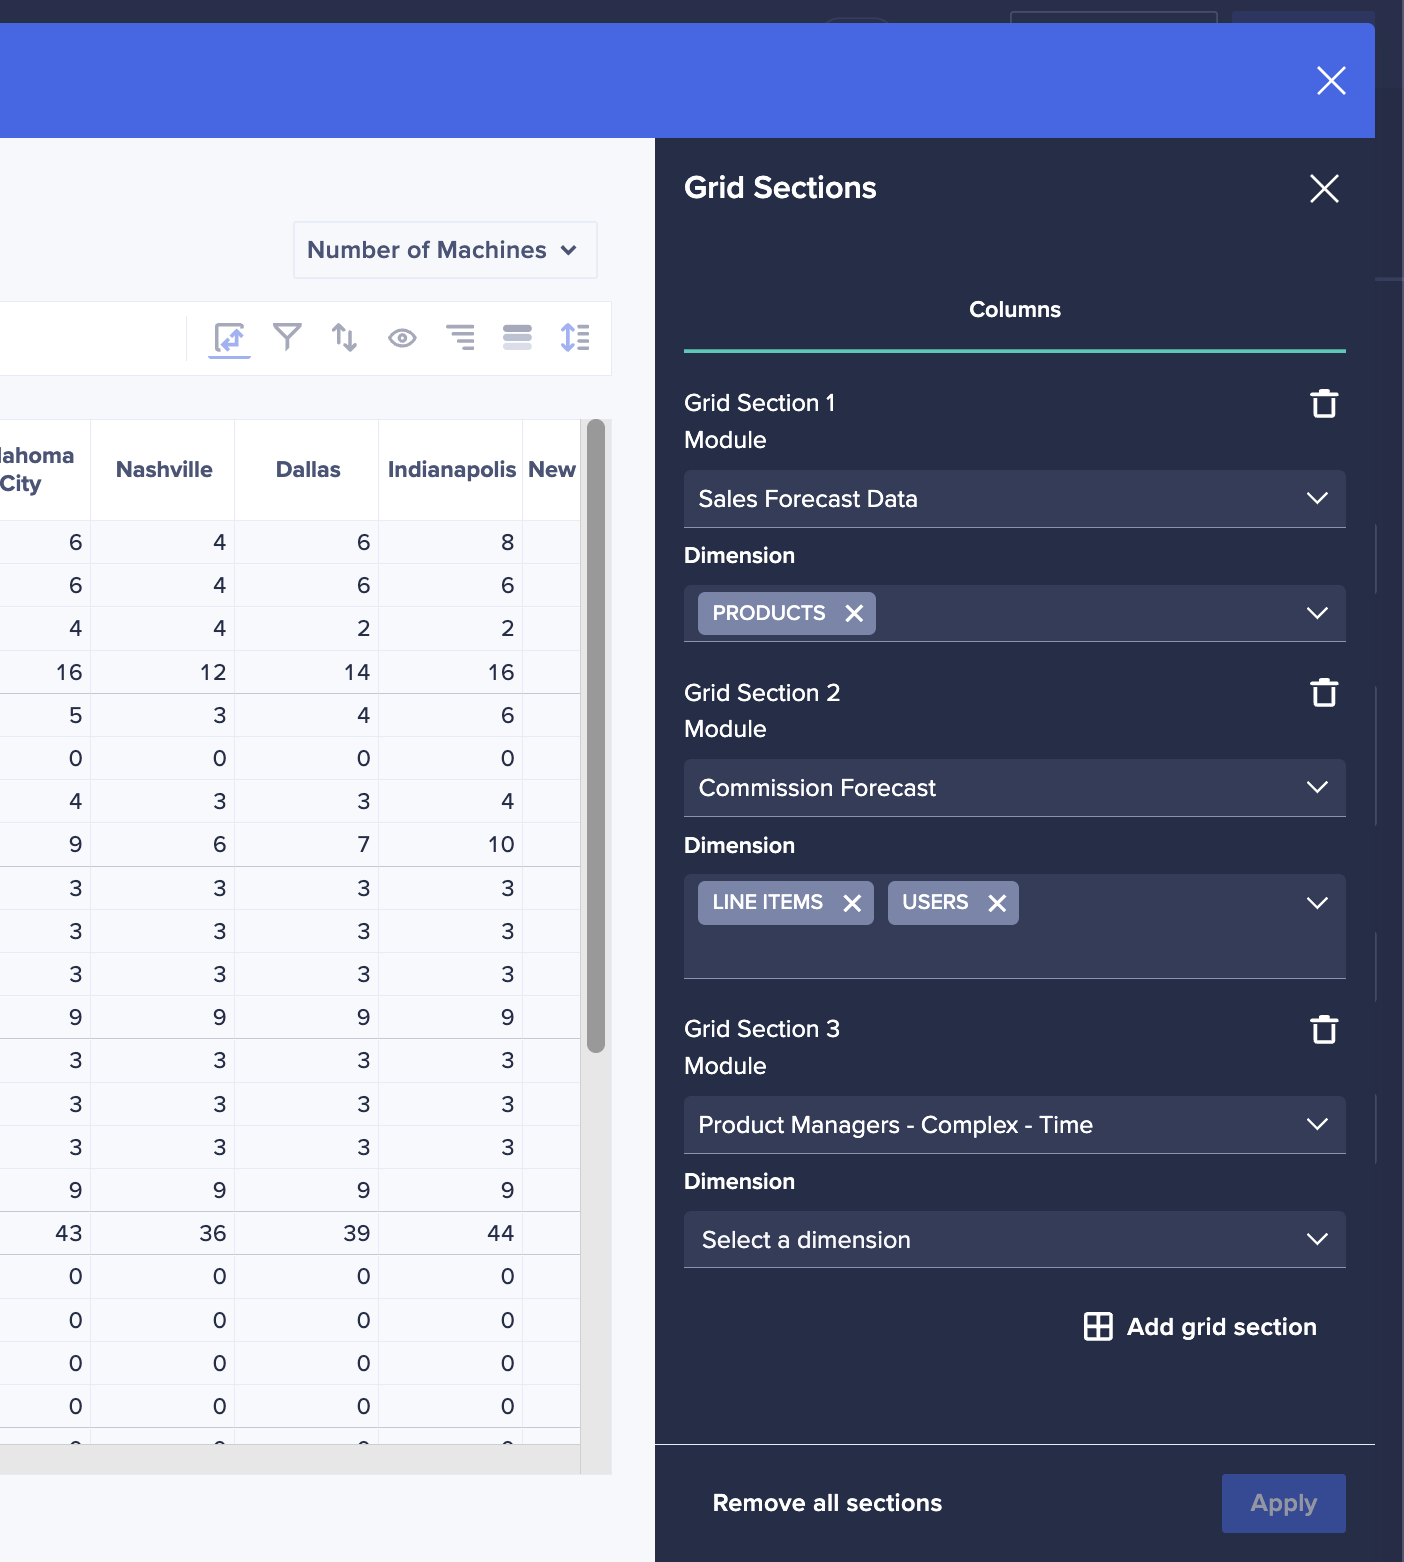
- Combine Grids: In "View designer" mode, click on the ‘Add Grid Sections’ button located above the main grid. A right-hand panel will appear allowing you to select up to four additional modules to combine to your primary module. Remember, for grids to be combined, they must have a common row axis so, all dimensions in rows must be present in the additional modules you wish to add.
- Apply customizations and publish: Apply any additional customizations, like conditional formatting or any filters, and when ready, click update and publish the page.
Tip: End users can make use of the existing ‘Freeze rows/columns’ functionality and Freeze the columns in the first module (for example attributes) so they are always visible when looking at your combined grid.
Just the beginning…
We are incredibly proud to deliver Combined Grids, an enhancement that we know many of you have been eagerly anticipating. Our team has worked hard to bring this powerful capability to life, and we see it as just the start of the journey. We are already working on what comes next. In upcoming releases, you can look forward to more flexibility, including the ability to reorder the Grid Sections within your combined grid and better, more clear labelling of Grid Sections when making customizations to your view.
Looking further ahead, we will continue to explore ways to provide even more freedom, investigating how we might allow you to combine more modules, even without a perfectly common axis. We cannot wait to see the transformations, efficiency gains, and time savings you will achieve with this new feature. Your feedback is what drives our innovation, and we look forward to hearing about the incredible solutions you build.
Additional resources